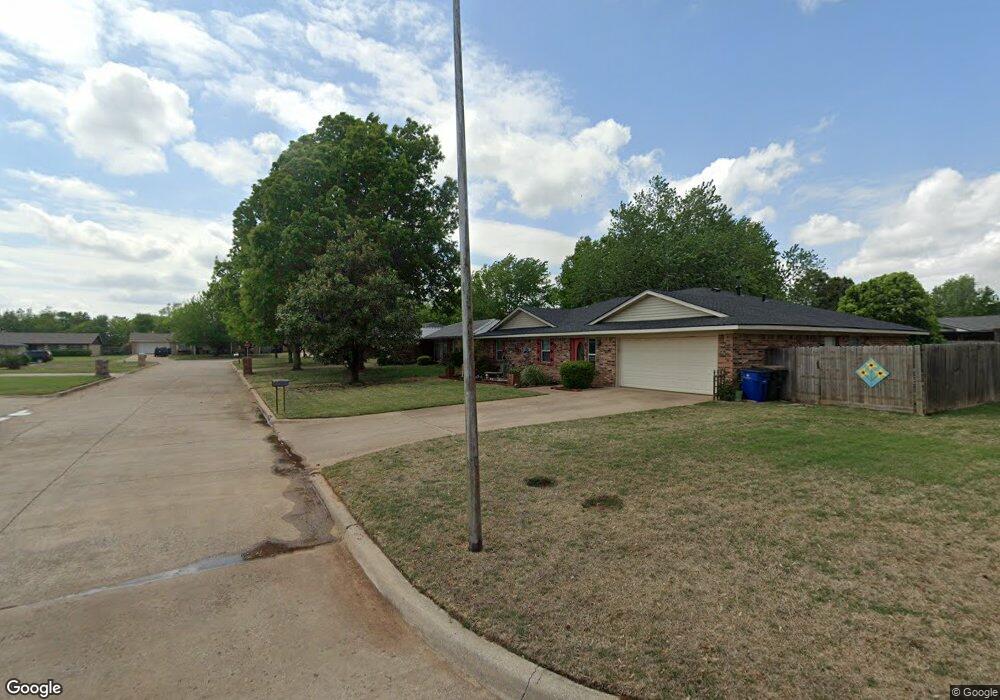
1931 Green Briar Cir Duncan, OK 73533
Estimated Value: $178,093 - $194,000
3
Beds
2
Baths
1,775
Sq Ft
$105/Sq Ft
Est. Value
About This Home
This home is located at 1931 Green Briar Cir, Duncan, OK 73533 and is currently estimated at $186,773, approximately $105 per square foot. 1931 Green Briar Cir is a home located in Stephens County with nearby schools including Horace Mann Elementary School, Duncan Middle School, and Duncan High School.
Ownership History
Date
Name
Owned For
Owner Type
Purchase Details
Closed on
Dec 20, 2018
Sold by
Wilmington Savings Fund Society
Bought by
Girod Tina and Girod Daimon Heath
Current Estimated Value
Purchase Details
Closed on
May 14, 2007
Sold by
Obermiller David W and Obermiller Melissa A
Bought by
Cox Teddy Ray and Cox Diana Gail
Home Financials for this Owner
Home Financials are based on the most recent Mortgage that was taken out on this home.
Original Mortgage
$132,914
Interest Rate
6.13%
Mortgage Type
FHA
Purchase Details
Closed on
Jun 15, 2005
Sold by
Landrum Phillip R and Landrum Marjorie W
Bought by
Obermiller David W
Home Financials for this Owner
Home Financials are based on the most recent Mortgage that was taken out on this home.
Original Mortgage
$122,580
Interest Rate
5.76%
Mortgage Type
VA
Purchase Details
Closed on
Jul 6, 1992
Sold by
Walker Eleanor
Create a Home Valuation Report for This Property
The Home Valuation Report is an in-depth analysis detailing your home's value as well as a comparison with similar homes in the area
Home Values in the Area
Average Home Value in this Area
Purchase History
| Date | Buyer | Sale Price | Title Company |
|---|---|---|---|
| Girod Tina | $75,050 | Solidifi Title & Closing | |
| Cox Teddy Ray | $135,000 | None Available | |
| Obermiller David W | $120,000 | None Available | |
| -- | $71,000 | -- |
Source: Public Records
Mortgage History
| Date | Status | Borrower | Loan Amount |
|---|---|---|---|
| Previous Owner | Cox Teddy Ray | $132,914 | |
| Previous Owner | Obermiller David W | $122,580 |
Source: Public Records
Tax History Compared to Growth
Tax History
| Year | Tax Paid | Tax Assessment Tax Assessment Total Assessment is a certain percentage of the fair market value that is determined by local assessors to be the total taxable value of land and additions on the property. | Land | Improvement |
|---|---|---|---|---|
| 2025 | $906 | $11,164 | $1,192 | $9,972 |
| 2024 | $906 | $10,632 | $1,192 | $9,440 |
| 2023 | $906 | $10,632 | $1,192 | $9,440 |
| 2022 | $820 | $10,126 | $1,192 | $8,934 |
| 2021 | $821 | $9,644 | $1,192 | $8,452 |
| 2020 | $755 | $8,747 | $1,192 | $7,555 |
| 2019 | $749 | $8,663 | $1,192 | $7,471 |
| 2018 | $890 | $10,996 | $1,192 | $9,804 |
| 2017 | $958 | $12,152 | $1,192 | $10,960 |
| 2016 | $1,026 | $13,069 | $1,192 | $11,877 |
| 2015 | $1,107 | $13,069 | $1,192 | $11,877 |
| 2014 | $1,107 | $13,069 | $1,192 | $11,877 |
Source: Public Records
Map
Nearby Homes
- 1927 High Meadow Dr
- 1829 1829 Terrace Dr
- 1706 Windsor Dr
- 2403 Meadow View Dr
- 2360 Rockwell Dr
- 2321 Rockwell Dr
- 3990 N Ridgeview Dr
- 30 Canterbury Ln
- 28 Canterbury Ln
- 2201 W Club Rd
- 2108 W Club Rd
- 2110 W Club Rd
- 2120 2120 Flamingo Ln
- 1601 1601 Pearl
- 2814 2814 Springdale Ln
- 2202 W Canary Ave
- 1404 1404 Ne Aspen
- 1527 1527 N 13th
- 1405 Evergreen Dr
- 1108 W Plato Rd Unit 29
- 1927 Green Briar Cir
- 1935 Green Briar Cir
- 1930 High Meadow Dr
- 1926 High Meadow Dr
- 1926 1926 High Meadow Dr
- 1934 High Meadow Dr
- 1923 Green Briar Cir
- 1930 Green Briar Cir
- 1934 Green Briar Cir
- 1926 Green Briar Cir
- 1922 High Meadow Dr
- 2105 Overland Dr
- 2109 Overland Dr
- 1918 High Meadow Dr
- 1918 High Meadow Dr
- 2113 Overland Dr
- 1917 Green Briar Cir
- 2025 Overland Dr
- 2117 Overland Dr
- 1931 Ridgeway Cir