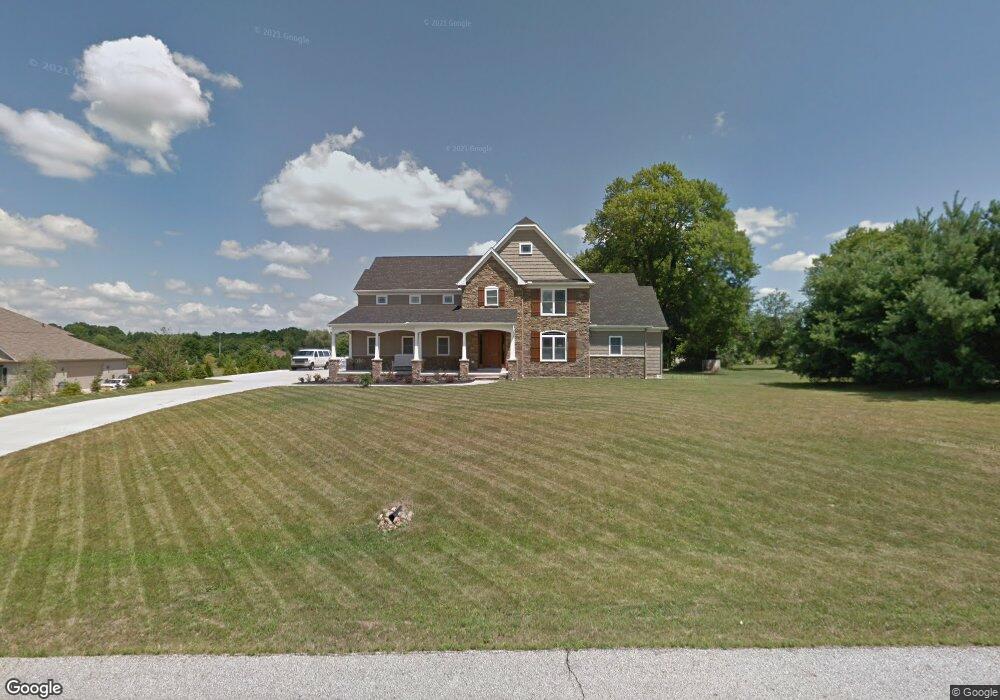
1931 Serenity Ln Copley, OH 44321
Estimated Value: $795,000 - $1,014,000
5
Beds
6
Baths
4,626
Sq Ft
$191/Sq Ft
Est. Value
About This Home
This home is located at 1931 Serenity Ln, Copley, OH 44321 and is currently estimated at $883,057, approximately $190 per square foot. 1931 Serenity Ln is a home located in Summit County with nearby schools including Highland Middle School, Highland High School, and Spring Garden Waldorf School.
Ownership History
Date
Name
Owned For
Owner Type
Purchase Details
Closed on
Dec 27, 2022
Sold by
Wolf Creek Estates Limited
Bought by
Bruce J May Family Trust
Current Estimated Value
Purchase Details
Closed on
Dec 14, 2007
Sold by
Dies Rebecca Molloy and Dies Robert J
Bought by
Alexander Darlene
Home Financials for this Owner
Home Financials are based on the most recent Mortgage that was taken out on this home.
Original Mortgage
$57,700
Interest Rate
6.31%
Mortgage Type
Purchase Money Mortgage
Purchase Details
Closed on
Sep 30, 2004
Sold by
Wolf Creek Estates Ltd
Bought by
Molloy Rebecca M
Home Financials for this Owner
Home Financials are based on the most recent Mortgage that was taken out on this home.
Original Mortgage
$58,400
Interest Rate
5%
Mortgage Type
Purchase Money Mortgage
Create a Home Valuation Report for This Property
The Home Valuation Report is an in-depth analysis detailing your home's value as well as a comparison with similar homes in the area
Home Values in the Area
Average Home Value in this Area
Purchase History
| Date | Buyer | Sale Price | Title Company |
|---|---|---|---|
| Bruce J May Family Trust | -- | -- | |
| Wince Thomas F | -- | -- | |
| Alexander Darlene | $77,000 | Diamond Title Co | |
| Molloy Rebecca M | $73,000 | Johnson & Parrish Title Agen |
Source: Public Records
Mortgage History
| Date | Status | Borrower | Loan Amount |
|---|---|---|---|
| Previous Owner | Alexander Darlene | $57,700 | |
| Previous Owner | Molloy Rebecca M | $58,400 |
Source: Public Records
Tax History
| Year | Tax Paid | Tax Assessment Tax Assessment Total Assessment is a certain percentage of the fair market value that is determined by local assessors to be the total taxable value of land and additions on the property. | Land | Improvement |
|---|---|---|---|---|
| 2024 | $13,702 | $256,075 | $29,838 | $226,237 |
| 2023 | $13,702 | $256,075 | $29,838 | $226,237 |
| 2022 | $12,368 | $206,511 | $24,063 | $182,448 |
| 2021 | $12,679 | $206,511 | $24,063 | $182,448 |
| 2020 | $12,764 | $206,510 | $24,060 | $182,450 |
| 2019 | $15,764 | $242,360 | $23,580 | $218,780 |
| 2018 | $15,511 | $242,360 | $23,580 | $218,780 |
| 2017 | $12,527 | $242,360 | $23,580 | $218,780 |
| 2016 | $12,247 | $198,240 | $23,580 | $174,660 |
| 2015 | $12,527 | $198,240 | $23,580 | $174,660 |
| 2014 | $12,384 | $198,240 | $23,580 | $174,660 |
| 2013 | $12,414 | $198,960 | $23,580 | $175,380 |
Source: Public Records
Map
Nearby Homes
- 2197 S Medina Line Rd
- 2430 S Hametown Rd
- 4360 Copley Rd
- 3730 S Sunnyfield Dr
- 175 Hahns Way
- 1205 Jonah Dr
- 2899 S Hametown Rd
- 0 Reimer Rd Unit 3968822
- 4000 Reimer Rd
- 1638 S Cleveland Massillon Rd
- 2938 S Hametown Rd
- 2857 Maco Dr
- 3385 Hemphill Rd
- 0 Dutt Rd Unit 5203758
- 3246 Stimson Rd
- 4077 Stonebridge Blvd
- 3623 Manning Tree Dr
- 482 Brentwood Blvd
- 246 Ridgewood Rd
- 214 Gatwick Grove Cir
Your Personal Tour Guide
Ask me questions while you tour the home.