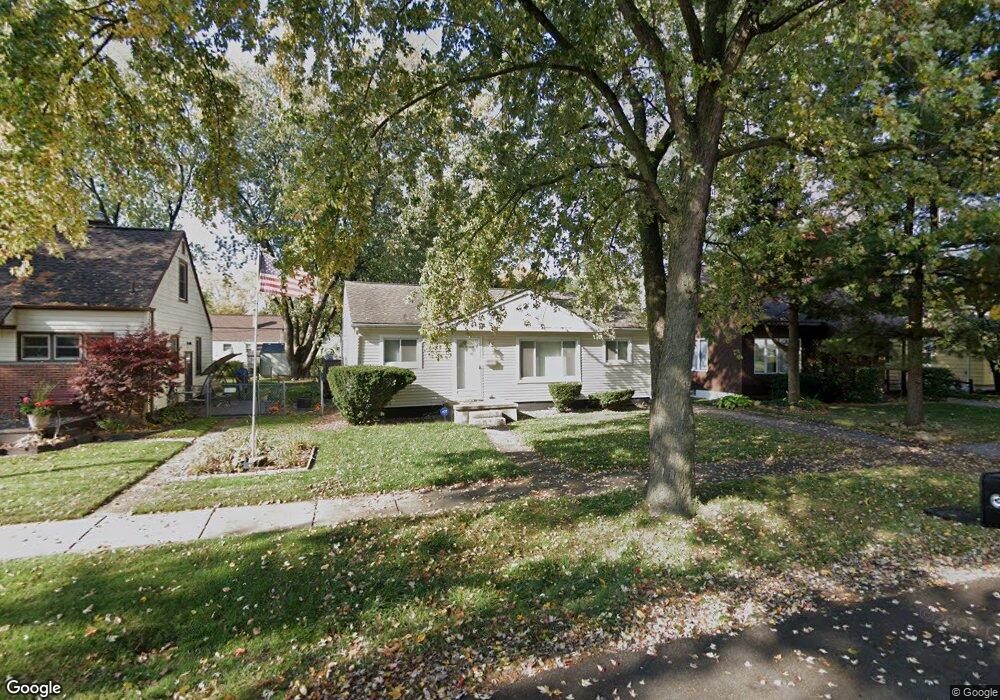
19315 Denby Redford, MI 48240
Estimated Value: $163,000 - $180,000
3
Beds
1
Bath
1,026
Sq Ft
$167/Sq Ft
Est. Value
About This Home
This home is located at 19315 Denby, Redford, MI 48240 and is currently estimated at $171,596, approximately $167 per square foot. 19315 Denby is a home located in Wayne County with nearby schools including Beech Elementary School, Hilbert Middle School, and Redford Union High School.
Ownership History
Date
Name
Owned For
Owner Type
Purchase Details
Closed on
Dec 23, 2011
Sold by
Redford Township Community Development
Bought by
Evans Tywan
Current Estimated Value
Purchase Details
Closed on
Mar 25, 2010
Sold by
Weber Jeffrey and Weber Nancy
Bought by
Federal National Mortgage Association
Purchase Details
Closed on
Dec 11, 2007
Sold by
Weber Jeffrey A
Bought by
Weber Nancy D
Purchase Details
Closed on
Oct 15, 1999
Sold by
Harris Becky E
Bought by
Weber Jeffrey Weber
Purchase Details
Closed on
May 17, 1996
Sold by
Richard N Rhodes and Richard Becky
Bought by
Accettura Michelangelo and Accettura Kimberly E
Create a Home Valuation Report for This Property
The Home Valuation Report is an in-depth analysis detailing your home's value as well as a comparison with similar homes in the area
Home Values in the Area
Average Home Value in this Area
Purchase History
| Date | Buyer | Sale Price | Title Company |
|---|---|---|---|
| Evans Tywan | $57,000 | Multiple | |
| Federal National Mortgage Association | $97,035 | None Available | |
| Weber Nancy D | -- | None Available | |
| Weber Jeffrey Weber | $99,900 | -- | |
| Accettura Michelangelo | $75,000 | -- |
Source: Public Records
Tax History Compared to Growth
Tax History
| Year | Tax Paid | Tax Assessment Tax Assessment Total Assessment is a certain percentage of the fair market value that is determined by local assessors to be the total taxable value of land and additions on the property. | Land | Improvement |
|---|---|---|---|---|
| 2025 | $685 | $76,300 | $0 | $0 |
| 2024 | $685 | $73,400 | $0 | $0 |
| 2023 | $653 | $58,300 | $0 | $0 |
| 2022 | $2,589 | $49,900 | $0 | $0 |
| 2021 | $2,391 | $46,200 | $0 | $0 |
| 2020 | $2,428 | $37,600 | $0 | $0 |
| 2019 | $1,882 | $34,100 | $0 | $0 |
| 2018 | $589 | $25,800 | $0 | $0 |
| 2017 | $1,520 | $23,700 | $0 | $0 |
| 2016 | $1,509 | $22,200 | $0 | $0 |
| 2015 | $2,116 | $21,700 | $0 | $0 |
| 2013 | $2,050 | $21,300 | $0 | $0 |
| 2012 | -- | $24,900 | $5,900 | $19,000 |
Source: Public Records
Map
Nearby Homes