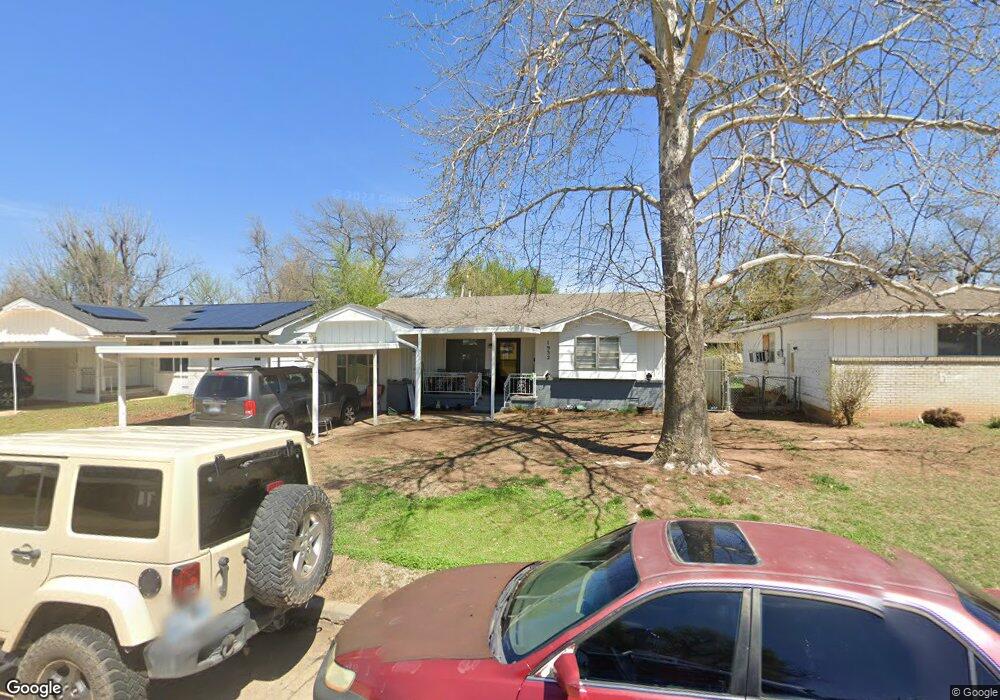
1932 N Mitchell Dr Oklahoma City, OK 73110
Estimated Value: $131,000 - $139,000
4
Beds
2
Baths
1,345
Sq Ft
$100/Sq Ft
Est. Value
About This Home
This home is located at 1932 N Mitchell Dr, Oklahoma City, OK 73110 and is currently estimated at $135,064, approximately $100 per square foot. 1932 N Mitchell Dr is a home located in Oklahoma County with nearby schools including Midwest City High School and St Philip Neri School.
Ownership History
Date
Name
Owned For
Owner Type
Purchase Details
Closed on
Oct 26, 2022
Sold by
Ogle Property Solutions Llc
Bought by
N9 Inc
Current Estimated Value
Home Financials for this Owner
Home Financials are based on the most recent Mortgage that was taken out on this home.
Original Mortgage
$133,333
Outstanding Balance
$128,444
Interest Rate
6.02%
Mortgage Type
New Conventional
Estimated Equity
$6,620
Purchase Details
Closed on
Jun 12, 2013
Sold by
Barron Billie Frances
Bought by
The Billie Barron Living Trust
Purchase Details
Closed on
Jul 7, 2000
Sold by
Gravitt John L and Gravitt Mary
Bought by
Barron Moss L
Purchase Details
Closed on
Jul 5, 2000
Sold by
Gravitt Luther and Gravitt Linda Carol
Bought by
Barron Moss L
Purchase Details
Closed on
Oct 12, 1999
Sold by
Jones Arthur
Bought by
Gravitt Johnny and Gravitt Luther
Create a Home Valuation Report for This Property
The Home Valuation Report is an in-depth analysis detailing your home's value as well as a comparison with similar homes in the area
Home Values in the Area
Average Home Value in this Area
Purchase History
| Date | Buyer | Sale Price | Title Company |
|---|---|---|---|
| N9 Inc | $95,000 | Escrow Title Services Inc | |
| Ogle Property Solutions Llc | $60,000 | Escrow Title Services Inc | |
| The Billie Barron Living Trust | -- | None Available | |
| Barron Moss L | $26,000 | Capitol Abstract & Title Co | |
| Barron Moss L | $26,000 | Capitol Abstract & Title Co | |
| Gravitt Johnny | -- | -- |
Source: Public Records
Mortgage History
| Date | Status | Borrower | Loan Amount |
|---|---|---|---|
| Open | N9 Inc | $133,333 |
Source: Public Records
Tax History Compared to Growth
Tax History
| Year | Tax Paid | Tax Assessment Tax Assessment Total Assessment is a certain percentage of the fair market value that is determined by local assessors to be the total taxable value of land and additions on the property. | Land | Improvement |
|---|---|---|---|---|
| 2024 | $1,243 | $11,088 | $2,197 | $8,891 |
| 2023 | $1,243 | $10,560 | $1,557 | $9,003 |
| 2022 | $709 | $7,076 | $1,027 | $6,049 |
| 2021 | $726 | $7,076 | $1,214 | $5,862 |
| 2020 | $746 | $7,076 | $1,353 | $5,723 |
| 2019 | $714 | $7,076 | $1,177 | $5,899 |
| 2018 | $670 | $7,076 | $0 | $0 |
| 2017 | $680 | $7,075 | $1,305 | $5,770 |
| 2016 | $699 | $7,075 | $1,344 | $5,731 |
| 2015 | $728 | $7,075 | $1,387 | $5,688 |
| 2014 | $727 | $7,075 | $1,433 | $5,642 |
Source: Public Records
Map
Nearby Homes
- 921 Brown Dr
- 1800 N Mitchell Dr
- 909 Holoway Dr
- 1701 Rulane Dr
- 1613 Sandra Dr
- 1020 Harold Dr
- 920 Arthur Dr
- 6125 SE 11th St
- 6609 SE 15th St
- 412 S Fox Dr
- 5804 SE 7th St
- 208 S Fox Dr
- 133 W Steed Dr
- 209 W Glenhaven Dr
- 816 S Sooner Rd
- 305 W Coe Dr
- 216 W Coe Dr
- 605 S Sooner Rd
- 125 W Coe Dr
- 601 Foster Place
- 1936 N Mitchell Dr
- 1928 N Mitchell Dr
- 1940 N Mitchell Dr
- 1924 N Mitchell Dr
- 1929 Treat Dr
- 1925 Treat Dr
- 1933 Treat Dr
- 1921 Treat Dr
- 1920 N Mitchell Dr
- 1944 N Mitchell Dr
- 1937 Treat Dr
- 1933 N Mitchell Dr
- 901 Brown Dr
- 1937 N Mitchell Dr
- 1917 Treat Dr
- 1941 Treat Dr
- 1916 N Mitchell Dr
- 2000 N Mitchell Dr
- 900 Boykin Dr
- 1921 N Mitchell Dr