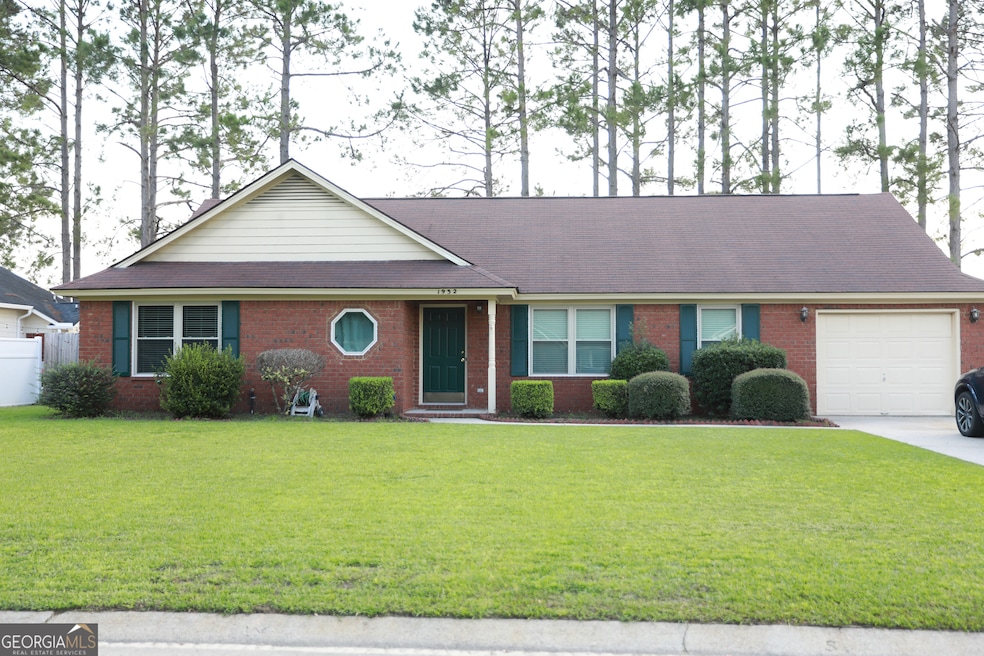
1932 Salisbury Way Hinesville, GA 31313
Estimated payment $1,653/month
Highlights
- Deck
- Wood Burning Stove
- Traditional Architecture
- Taylors Creek Elementary School Rated 9+
- Private Lot
- No HOA
About This Home
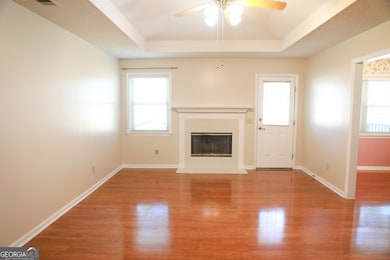
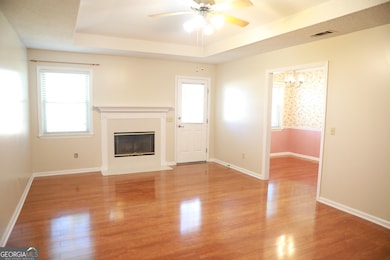
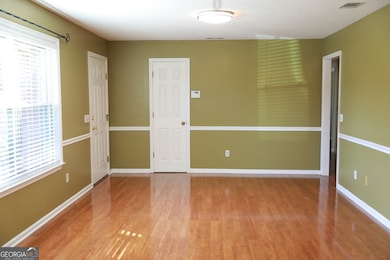
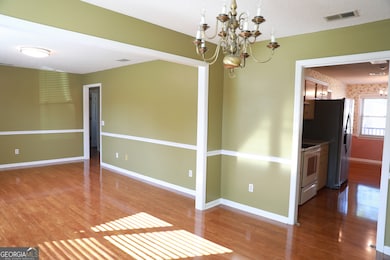
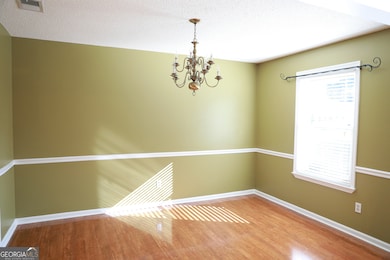
Step inside this charming 3-bedroom, 2-bathroom well maintained home. The warm welcoming layout features vinyl hardwood flooring throughout the main living areas for both comfort and easy care. The living room with fireplace is perfect for family gatherings, while the kitchen and dining area offer room to share meals and create memories. Private fenced in spacious backyard for outdoor activities. Perfect for buyers looking for a solid home with the opportunity to add their own personal touch. Located in a friendly neighborhood and just minutes from Ft Stewart, schools, and local shopping. Schedule your showing today!
Listing Agent
Kelly O'Kelley RE Consultants Brokerage Phone: 6789848099 License #297640 Listed on: 09/25/2025
Home Details
Home Type
- Single Family
Est. Annual Taxes
- $2,442
Year Built
- Built in 1996
Lot Details
- 9,583 Sq Ft Lot
- Back Yard Fenced
- Private Lot
Parking
- 1 Car Garage
Home Design
- Traditional Architecture
- Slate Roof
- Four Sided Brick Exterior Elevation
Interior Spaces
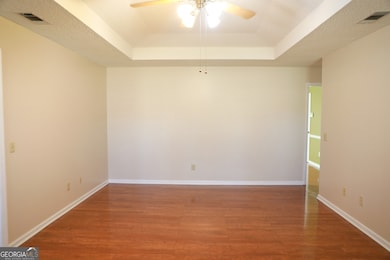
- 1-Story Property
- Ceiling Fan
- Wood Burning Stove
- Family Room with Fireplace
- Combination Dining and Living Room
- Den
- Laminate Flooring
- Fire and Smoke Detector
Kitchen
- Breakfast Room
- Cooktop
- Dishwasher
- Disposal
Bedrooms and Bathrooms
- 3 Main Level Bedrooms
- 2 Full Bathrooms
Laundry
- Laundry Room
- Laundry in Kitchen
Outdoor Features
- Deck
- Shed
Schools
- Taylors Creek Elementary School
- Lewis Frasier Middle School
- Bradwell Institute High School
Utilities
- Central Heating and Cooling System
- High Speed Internet
- Phone Available
- Cable TV Available
Community Details
- No Home Owners Association
- Stonehenge Subdivision
Map
Home Values in the Area
Average Home Value in this Area
Tax History
| Year | Tax Paid | Tax Assessment Tax Assessment Total Assessment is a certain percentage of the fair market value that is determined by local assessors to be the total taxable value of land and additions on the property. | Land | Improvement |
|---|---|---|---|---|
| 2024 | $2,442 | $78,951 | $8,000 | $70,951 |
| 2023 | $2,442 | $70,761 | $8,000 | $62,761 |
| 2022 | $2,001 | $58,046 | $8,000 | $50,046 |
| 2021 | $1,926 | $52,956 | $8,000 | $44,956 |
| 2020 | $1,780 | $49,387 | $8,000 | $41,387 |
| 2019 | $1,792 | $49,904 | $8,000 | $41,904 |
| 2018 | $2,542 | $53,762 | $8,000 | $45,762 |
| 2017 | $1,789 | $54,320 | $8,000 | $46,320 |
| 2016 | $2,472 | $54,878 | $8,000 | $46,878 |
| 2015 | $2,484 | $50,190 | $8,000 | $42,190 |
| 2014 | $2,484 | $54,555 | $10,000 | $44,555 |
| 2013 | -- | $55,294 | $10,000 | $45,294 |
Property History
| Date | Event | Price | List to Sale | Price per Sq Ft |
|---|---|---|---|---|
| 09/25/2025 09/25/25 | For Sale | $275,000 | -- | -- |
Purchase History
| Date | Type | Sale Price | Title Company |
|---|---|---|---|
| Warranty Deed | $133,000 | -- | |
| Deed | $145,000 | -- | |
| Deed | $101,000 | -- | |
| Deed | $95,000 | -- | |
| Deed | $13,000 | -- |
Mortgage History
| Date | Status | Loan Amount | Loan Type |
|---|---|---|---|
| Open | $126,350 | New Conventional | |
| Previous Owner | $29,000 | New Conventional | |
| Previous Owner | $116,000 | New Conventional |
Source: Georgia MLS
MLS Number: 10614320
APN: 039B-050
Disclaimer: Certain information contained herein is derived from information provided by parties other than Homes.com. All information provided is deemed reliable, but is not guaranteed to be accurate and should be independently verified.
![]() The data relating to real estate for sale on this web site comes in part from the Broker Reciprocity Program of Georgia MLS. Real estate listings held by brokerage firms other than Redfin are marked with the Broker Reciprocity logo and detailed information about them includes the name of the listing brokers. Information deemed reliable but not guaranteed. Copyright 2025 Georgia MLS. All rights reserved.
The data relating to real estate for sale on this web site comes in part from the Broker Reciprocity Program of Georgia MLS. Real estate listings held by brokerage firms other than Redfin are marked with the Broker Reciprocity logo and detailed information about them includes the name of the listing brokers. Information deemed reliable but not guaranteed. Copyright 2025 Georgia MLS. All rights reserved.
- 1905 Stonehenge Dr
- 1936 Heathrow Dr
- 2131 Walberg Dr
- 315 Joann Lewis Ln
- 170 Joann Lewis Ln
- 122 Joann Lewis Ln
- 1325 Loblolly Dr
- 2411 Fernando Ct
- 1302 Loblolly Dr
- 1430 Evergreen Trail
- 1240 Pineridge Way
- 401 Barry McCaffrey Blvd Unit E1
- 401 Barry McCaffrey Blvd Unit K2
- 401 Barry McCaffrey Blvd Unit C3
- 1429 Evergreen Trail
- 316 Clairemore Cir
- 104 Shallowford Cir
- 1231 Pineridge Way
- 311 Kevin Rd
- 205 Bridgemont Way
- 1429 Evergreen Trail
- 418 Lancaster Loop
- 67 Rosebud Ct
- 18 St Johns Ct
- 1301 Windrow Dr
- 179 Crosby Dr
- 1596 Longleaf Ct
- 1134 Kelly Dr Unit 64
- 1134 Kelly Dr Unit 6
- 1134 Kelly Dr Unit 43
- 703 Waterfield Dr
- 1106 Ricade Dr
- 57 Belleau Woods Cir
- 15 Belleau Woods Cir
- 1758 Ashton Dr
- 265 Miller St
- 1616 Seneca Ln
- 1065 Kelly Dr
- 116 Mattie St
- 1308 Tower Dr
