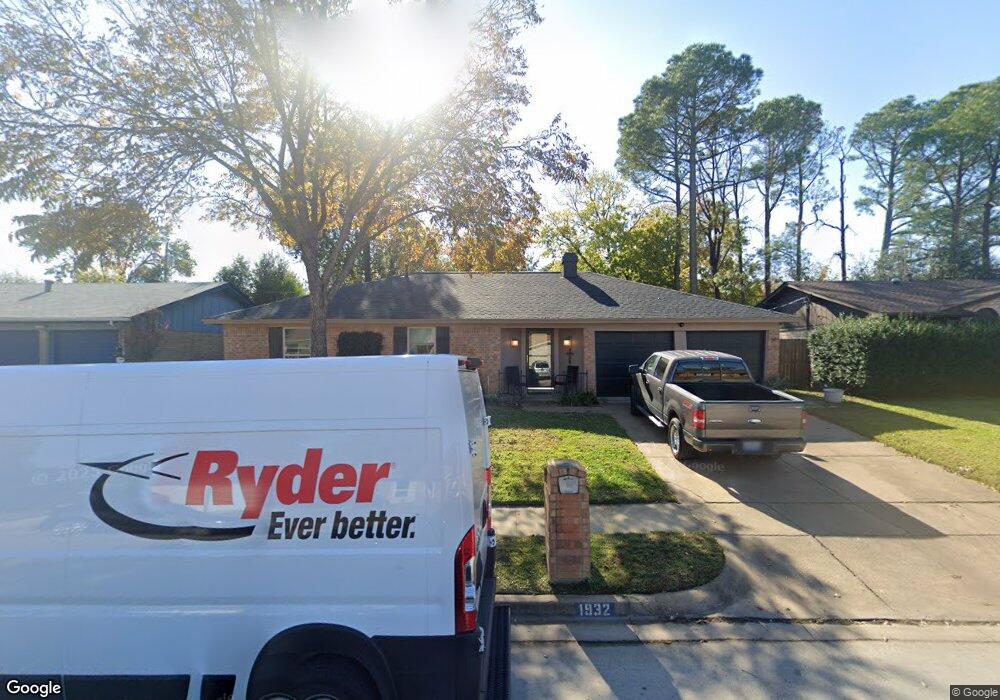
1932 Schumac Ln Bedford, TX 76022
Estimated Value: $300,000 - $320,000
3
Beds
2
Baths
1,439
Sq Ft
$216/Sq Ft
Est. Value
About This Home
This home is located at 1932 Schumac Ln, Bedford, TX 76022 and is currently estimated at $310,632, approximately $215 per square foot. 1932 Schumac Ln is a home located in Tarrant County with nearby schools including Bell Manor Elementary School, Central J High School, and Trinity High School.
Ownership History
Date
Name
Owned For
Owner Type
Purchase Details
Closed on
May 25, 2010
Sold by
Adams Shawn L and Adams Holli G
Bought by
Ambrose Steve
Current Estimated Value
Home Financials for this Owner
Home Financials are based on the most recent Mortgage that was taken out on this home.
Original Mortgage
$92,000
Outstanding Balance
$61,513
Interest Rate
5%
Mortgage Type
Purchase Money Mortgage
Estimated Equity
$249,119
Purchase Details
Closed on
Nov 21, 2005
Sold by
Threadgill Thelma R
Bought by
Adams Shawn L and Adams Holli G
Home Financials for this Owner
Home Financials are based on the most recent Mortgage that was taken out on this home.
Original Mortgage
$73,000
Interest Rate
6.04%
Mortgage Type
Fannie Mae Freddie Mac
Purchase Details
Closed on
Jan 10, 1997
Sold by
Timmons Ruth Ann
Bought by
Threadgill John M and Threadgill Thelma R
Create a Home Valuation Report for This Property
The Home Valuation Report is an in-depth analysis detailing your home's value as well as a comparison with similar homes in the area
Home Values in the Area
Average Home Value in this Area
Purchase History
| Date | Buyer | Sale Price | Title Company |
|---|---|---|---|
| Ambrose Steve | -- | Federal Title Inc | |
| Adams Shawn L | -- | Ranger Title Co | |
| Threadgill John M | -- | -- |
Source: Public Records
Mortgage History
| Date | Status | Borrower | Loan Amount |
|---|---|---|---|
| Open | Ambrose Steve | $92,000 | |
| Previous Owner | Adams Shawn L | $73,000 |
Source: Public Records
Tax History Compared to Growth
Tax History
| Year | Tax Paid | Tax Assessment Tax Assessment Total Assessment is a certain percentage of the fair market value that is determined by local assessors to be the total taxable value of land and additions on the property. | Land | Improvement |
|---|---|---|---|---|
| 2025 | $2,163 | $224,260 | $65,000 | $159,260 |
| 2024 | $2,163 | $224,260 | $65,000 | $159,260 |
| 2023 | $3,914 | $204,071 | $45,000 | $159,071 |
| 2022 | $4,098 | $191,781 | $45,000 | $146,781 |
| 2021 | $4,018 | $170,581 | $45,000 | $125,581 |
| 2020 | $4,591 | $193,089 | $45,000 | $148,089 |
| 2019 | $4,723 | $194,399 | $45,000 | $149,399 |
| 2018 | $3,962 | $163,047 | $23,000 | $140,047 |
| 2017 | $3,581 | $148,020 | $23,000 | $125,020 |
| 2016 | $3,220 | $133,125 | $23,000 | $110,125 |
| 2015 | $2,858 | $113,800 | $18,000 | $95,800 |
| 2014 | $2,858 | $113,800 | $18,000 | $95,800 |
Source: Public Records
Map
Nearby Homes
- 2025 Schumac Ln
- 2201 Greendale Ct
- 1213 Greendale Dr
- 2024 Charleston Dr
- 1701 Winchester Way
- 2101 Gettysburg Place
- 933 Charleston Ct
- 952 Charleston Dr
- 1049 Stableway Ln
- 1116 Highpoint Rd
- 2421 Creek Villas Dr
- 1613 Trinity Ct
- 804 Natchez Ave
- 828 Gregory Ave
- 1604 Richmond Dr
- 2428 Chestnut Way
- 1509 Shirley Way
- 2420 Dalewood Ln
- 808 Gregory Ave
- 800 Prestwick St
- 1936 Schumac Ln
- 1928 Schumac Ln
- 1929 Memphis Dr
- 1933 Memphis Dr
- 2000 Schumac Ln
- 1925 Memphis Dr
- 1924 Schumac Ln
- 1937 Memphis Dr
- 1933 Schumac Ln
- 1921 Memphis Dr
- 1929 Schumac Ln
- 1937 Schumac Ln
- 2004 Schumac Ln
- 1920 Schumac Ln
- 1925 Schumac Ln
- 2001 Schumac Ln
- 2001 Memphis Dr
- 1917 Memphis Dr
- 2008 Schumac Ln
- 1921 Schumac Ln