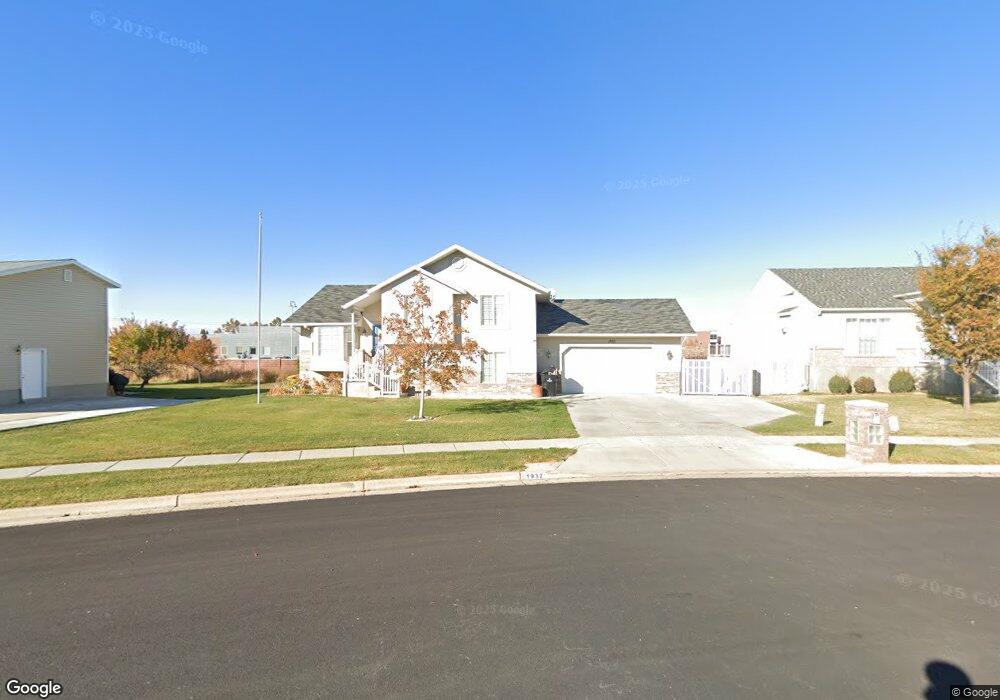
1932 W 2025 S Syracuse, UT 84075
Estimated Value: $502,000 - $565,000
3
Beds
3
Baths
1,339
Sq Ft
$395/Sq Ft
Est. Value
About This Home
This home is located at 1932 W 2025 S, Syracuse, UT 84075 and is currently estimated at $529,555, approximately $395 per square foot. 1932 W 2025 S is a home located in Davis County with nearby schools including Syracuse Elementary School, Syracuse Junior High School, and Syracuse High School.
Ownership History
Date
Name
Owned For
Owner Type
Purchase Details
Closed on
Jan 28, 2003
Sold by
Larsen Linda B
Bought by
Larsen Larry B and Larsen Linda B
Current Estimated Value
Home Financials for this Owner
Home Financials are based on the most recent Mortgage that was taken out on this home.
Original Mortgage
$180,000
Interest Rate
5.36%
Mortgage Type
Balloon
Purchase Details
Closed on
Jun 29, 1999
Sold by
Creekside Home Builders Llc
Bought by
Larsen Larry B and Larsen Linda B
Home Financials for this Owner
Home Financials are based on the most recent Mortgage that was taken out on this home.
Original Mortgage
$148,800
Interest Rate
12.5%
Purchase Details
Closed on
Dec 31, 1998
Sold by
Independence Subdivision Llc
Bought by
Creekside Home Builders Llc
Home Financials for this Owner
Home Financials are based on the most recent Mortgage that was taken out on this home.
Original Mortgage
$123,500
Interest Rate
6.82%
Create a Home Valuation Report for This Property
The Home Valuation Report is an in-depth analysis detailing your home's value as well as a comparison with similar homes in the area
Home Values in the Area
Average Home Value in this Area
Purchase History
| Date | Buyer | Sale Price | Title Company |
|---|---|---|---|
| Larsen Larry B | -- | Founders Title Company | |
| Larsen Linda B | -- | Founders Title Company | |
| Larsen Larry B | -- | First American Title Ins Co | |
| Creekside Home Builders Llc | -- | Bonneville Title Company Inc |
Source: Public Records
Mortgage History
| Date | Status | Borrower | Loan Amount |
|---|---|---|---|
| Closed | Larsen Linda B | $180,000 | |
| Closed | Larsen Larry B | $148,800 | |
| Previous Owner | Creekside Home Builders Llc | $123,500 | |
| Closed | Larsen Linda B | $10,500 |
Source: Public Records
Tax History Compared to Growth
Tax History
| Year | Tax Paid | Tax Assessment Tax Assessment Total Assessment is a certain percentage of the fair market value that is determined by local assessors to be the total taxable value of land and additions on the property. | Land | Improvement |
|---|---|---|---|---|
| 2025 | $2,805 | $270,600 | $126,251 | $144,349 |
| 2024 | $2,678 | $260,150 | $105,654 | $154,496 |
| 2023 | $2,486 | $440,000 | $147,145 | $292,855 |
| 2022 | $2,698 | $261,800 | $84,532 | $177,268 |
| 2021 | $2,403 | $361,000 | $125,060 | $235,940 |
| 2020 | $2,111 | $307,000 | $108,320 | $198,680 |
| 2019 | $2,006 | $288,000 | $106,638 | $181,362 |
| 2018 | $1,993 | $284,000 | $102,580 | $181,420 |
| 2016 | $1,734 | $129,580 | $39,345 | $90,235 |
| 2015 | $1,655 | $117,755 | $39,345 | $78,410 |
| 2014 | $1,548 | $112,260 | $39,345 | $72,915 |
| 2013 | -- | $107,061 | $32,599 | $74,462 |
Source: Public Records
Map
Nearby Homes
- 2047 S 2000 W
- 2000 S 1800 W
- 2082 S 1730 W
- 2194 S 1800 W
- 1932 S 2150 W
- 2104 W 2200 S
- 2136 W 2200 S
- 1836 W 2400 S
- 2297 W 2175 S
- 4344 W 1825 S Unit 102
- 4354 W 1825 S Unit 104
- 4348 W 1825 S Unit 103
- 2503 S 1875 W
- 1466 Earl Cir
- 1918 S 2465 W
- 2208 W 2615 S Unit 141
- 2198 W 2615 S Unit 140
- 2158 W 2615 S Unit 137
- 1641 S 2350 W Unit B
- 2650 S 2000 W