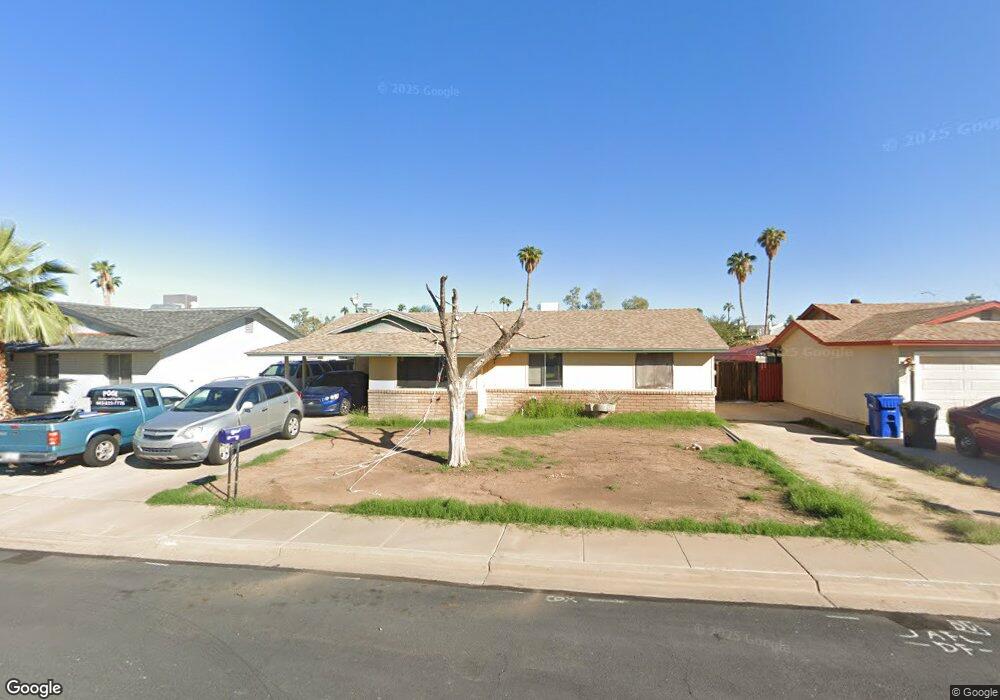
1932 W Dartmouth St Mesa, AZ 85201
Riverview NeighborhoodEstimated Value: $333,634 - $442,000
--
Bed
2
Baths
1,308
Sq Ft
$304/Sq Ft
Est. Value
About This Home
This home is located at 1932 W Dartmouth St, Mesa, AZ 85201 and is currently estimated at $397,159, approximately $303 per square foot. 1932 W Dartmouth St is a home located in Maricopa County with nearby schools including Whittier Elementary School, Franklin at Brimhall Elementary School, and Franklin West Elementary School.
Ownership History
Date
Name
Owned For
Owner Type
Purchase Details
Closed on
Apr 18, 2007
Sold by
Cipolla Brett A and Cipolla Shannon L
Bought by
Cipolla Brett A and Cipolla Shannon L
Current Estimated Value
Home Financials for this Owner
Home Financials are based on the most recent Mortgage that was taken out on this home.
Original Mortgage
$97,000
Outstanding Balance
$58,487
Interest Rate
6.1%
Mortgage Type
Stand Alone Refi Refinance Of Original Loan
Estimated Equity
$338,672
Purchase Details
Closed on
Apr 11, 2007
Sold by
Cipolla Brett A and Cipolla Shannon L
Bought by
Cipolla Brett A and Cipolla Shannon L
Home Financials for this Owner
Home Financials are based on the most recent Mortgage that was taken out on this home.
Original Mortgage
$97,000
Outstanding Balance
$58,487
Interest Rate
6.1%
Mortgage Type
Stand Alone Refi Refinance Of Original Loan
Estimated Equity
$338,672
Create a Home Valuation Report for This Property
The Home Valuation Report is an in-depth analysis detailing your home's value as well as a comparison with similar homes in the area
Home Values in the Area
Average Home Value in this Area
Purchase History
| Date | Buyer | Sale Price | Title Company |
|---|---|---|---|
| Cipolla Brett A | -- | Ticor Title Agency Of Az Inc | |
| Cipolla Brett A | -- | Ticor Title Agency Of Az Inc |
Source: Public Records
Mortgage History
| Date | Status | Borrower | Loan Amount |
|---|---|---|---|
| Open | Cipolla Brett A | $97,000 | |
| Closed | Cipolla Brett A | $97,000 |
Source: Public Records
Tax History Compared to Growth
Tax History
| Year | Tax Paid | Tax Assessment Tax Assessment Total Assessment is a certain percentage of the fair market value that is determined by local assessors to be the total taxable value of land and additions on the property. | Land | Improvement |
|---|---|---|---|---|
| 2025 | $913 | $9,256 | -- | -- |
| 2024 | $916 | $8,816 | -- | -- |
| 2023 | $916 | $29,650 | $5,930 | $23,720 |
| 2022 | $897 | $22,360 | $4,470 | $17,890 |
| 2021 | $908 | $19,060 | $3,810 | $15,250 |
| 2020 | $896 | $17,960 | $3,590 | $14,370 |
| 2019 | $837 | $15,460 | $3,090 | $12,370 |
| 2018 | $804 | $13,520 | $2,700 | $10,820 |
| 2017 | $780 | $12,970 | $2,590 | $10,380 |
| 2016 | $765 | $11,800 | $2,360 | $9,440 |
| 2015 | $719 | $8,970 | $1,790 | $7,180 |
Source: Public Records
Map
Nearby Homes
- 534 N Ironwood
- 601 N May Unit 27
- 601 N May Unit 25
- 2064 W Camino Cir
- 2130 W Camino St Unit 7
- 633 N May Unit 25
- 451 N San Jose Cir
- 602 N May Unit 65
- 602 N May Unit 49
- 602 N May -- Unit 17
- 602 N May -- Unit 23
- 602 N May Unit 95
- 301 N Ironwood
- 540 N May Unit 3116
- 540 N May Unit 1109
- 540 N May Unit 1102C
- 2021 W 2nd Place
- 1638 W Bedford St
- 1500 W Rio Salado Pkwy Unit 76
- 1500 W Rio Salado Pkwy Unit 145
- 1938 W Dartmouth St
- 1926 W Dartmouth St
- 1929 W Devonshire St
- 1923 W Devonshire St
- 1935 W Devonshire St
- 1946 W Dartmouth St
- 1920 W Dartmouth St
- 1931 W Dartmouth St
- 1915 W Devonshire St
- 1943 W Devonshire St
- 1937 W Dartmouth St
- 1919 W Dartmouth St
- 1950 W Dartmouth St
- 1916 W Dartmouth St
- 1945 W Dartmouth St
- 1909 W Devonshire St
- 1947 W Devonshire St
- 1865 W Devonshire St
- 1949 W Dartmouth St
- 1958 W Dartmouth St