Estimated Value: $376,000 - $401,833
4
Beds
3
Baths
2,729
Sq Ft
$144/Sq Ft
Est. Value
About This Home
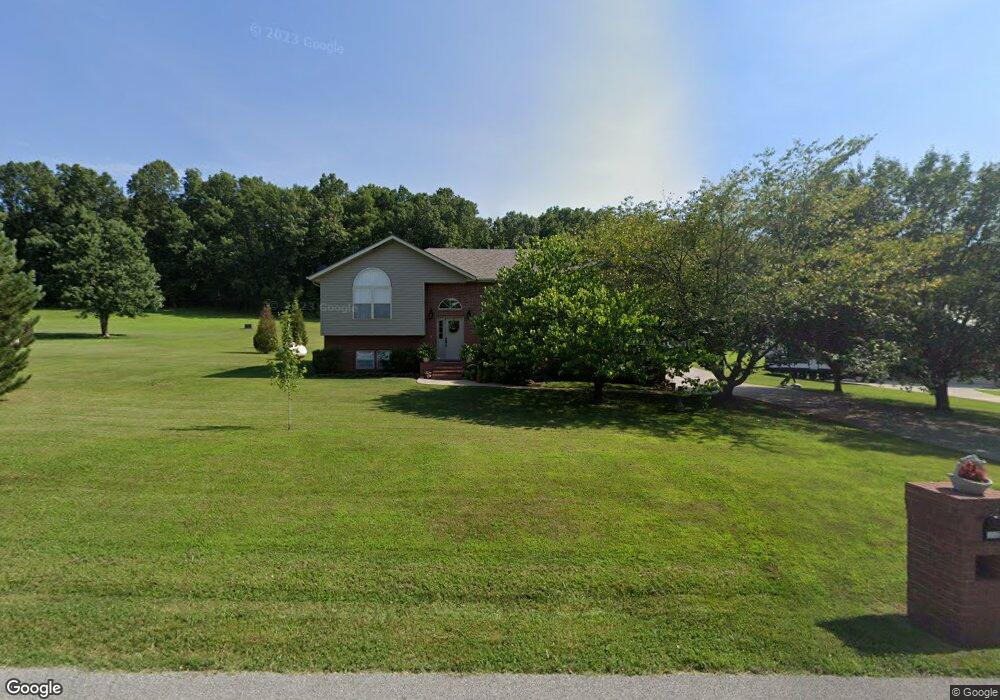
This home is located at 1932 W Patton Place, Nixa, MO 65714 and is currently estimated at $392,458, approximately $143 per square foot. 1932 W Patton Place is a home located in Christian County with nearby schools including Espy Elementary School, Nicholas A. Inman Intermediate School, and Nixa Junior High School.
Ownership History
Date
Name
Owned For
Owner Type
Purchase Details
Closed on
Jun 30, 2021
Sold by
Whitney Michael G and Whitney Stacey L
Bought by
Everding Kelly D and Everding Nathan L
Current Estimated Value
Home Financials for this Owner
Home Financials are based on the most recent Mortgage that was taken out on this home.
Original Mortgage
$271,200
Outstanding Balance
$246,072
Interest Rate
2.9%
Mortgage Type
New Conventional
Estimated Equity
$146,386
Purchase Details
Closed on
Mar 30, 2011
Sold by
Fannie Mae
Bought by
Whitney Michael G and Whitney Stacey L
Home Financials for this Owner
Home Financials are based on the most recent Mortgage that was taken out on this home.
Original Mortgage
$110,000
Interest Rate
4.92%
Mortgage Type
New Conventional
Purchase Details
Closed on
Jul 23, 2010
Sold by
Kozeny and Kozeny Mccubbin L
Bought by
Federal National Mortgage Association
Create a Home Valuation Report for This Property
The Home Valuation Report is an in-depth analysis detailing your home's value as well as a comparison with similar homes in the area
Home Values in the Area
Average Home Value in this Area
Purchase History
| Date | Buyer | Sale Price | Title Company |
|---|---|---|---|
| Everding Kelly D | -- | Hogan Land Title Co | |
| Whitney Michael G | -- | None Available | |
| Federal National Mortgage Association | $193,265 | None Available |
Source: Public Records
Mortgage History
| Date | Status | Borrower | Loan Amount |
|---|---|---|---|
| Open | Everding Kelly D | $271,200 | |
| Previous Owner | Whitney Michael G | $110,000 |
Source: Public Records
Tax History Compared to Growth
Tax History
| Year | Tax Paid | Tax Assessment Tax Assessment Total Assessment is a certain percentage of the fair market value that is determined by local assessors to be the total taxable value of land and additions on the property. | Land | Improvement |
|---|---|---|---|---|
| 2024 | $2,346 | $39,540 | -- | -- |
| 2023 | $2,346 | $39,540 | $0 | $0 |
| 2022 | $2,155 | $36,270 | $0 | $0 |
| 2021 | $2,156 | $36,270 | $0 | $0 |
| 2020 | $2,025 | $32,570 | $0 | $0 |
| 2019 | $2,025 | $32,570 | $0 | $0 |
| 2018 | $1,882 | $32,640 | $0 | $0 |
| 2017 | $1,882 | $32,640 | $0 | $0 |
| 2016 | $1,850 | $32,640 | $0 | $0 |
| 2015 | $1,853 | $32,640 | $32,640 | $0 |
| 2014 | $1,742 | $31,500 | $0 | $0 |
| 2013 | $17 | $31,500 | $0 | $0 |
| 2011 | $17 | $63,000 | $0 | $0 |
Source: Public Records
Map
Nearby Homes
- 2081 Green Meadow Ct
- 1710 Utah Ct
- 3262 W Bluffview St
- 3260 W Rivulet Pass
- 3260 W Ridge Run
- 3240 W Bluffview St
- 3239 W Bluffview St
- 3232 W Bluffview St
- 3231 W Bluffview St
- 3224 W Bluffview St
- 1522 W Porterfield Dr
- 2069 Preakness Dr
- 4930 S State Route Ff
- 2080 N Preakness Dr
- 3133 W Fieldstone Way
- 5878 S Canterbury Ln Unit Lot 128
- 5998 S Parkhaven Ln
- 5907 S Hollow Branch Way Unit Lot 123
- Shelby 5-Bed Basement Plan at Green Ridge
- Shelby Plan at Green Ridge
- 1922 W Patton Place
- 0 W Patton Place Unit 11200664
- 0 W Patton Place
- 000 W Patton Place
- 1954 W Patton Place
- 1935 W Patton Place
- 1929 W Patton Place
- 1943 W Patton Place
- 000 Patton
- 1937 Phillips Rd
- 1957 W Patton Place
- 1951 W Patton Place
- 1961 W Patton Place
- 1863 N Phillips Rd
- 1975 W Patton Place
- 1882 N South Brook Ct
- 1983 W Patton Place
- 1873 Hillview Dr
- 1881 N Suncrest Ct
- 1875 N Suncrest Ct