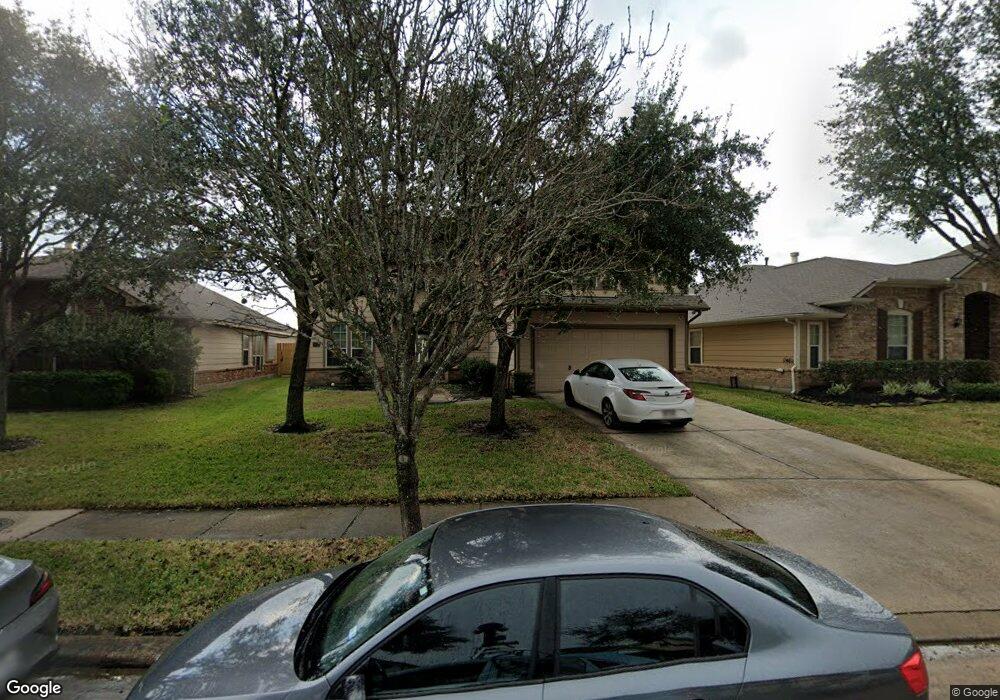
19322 Camellia Bend Cir Spring, TX 77379
Estimated Value: $368,022 - $405,000
4
Beds
3
Baths
2,787
Sq Ft
$137/Sq Ft
Est. Value
About This Home
This home is located at 19322 Camellia Bend Cir, Spring, TX 77379 and is currently estimated at $382,256, approximately $137 per square foot. 19322 Camellia Bend Cir is a home located in Harris County with nearby schools including Kuehnle Elementary School, Krimmel Intermediate School, and Klein High School.
Ownership History
Date
Name
Owned For
Owner Type
Purchase Details
Closed on
Apr 9, 2018
Sold by
Twardowski Jerry L and Twardowski Jodi L
Bought by
Phan Ngoc B and Nguyen Hai
Current Estimated Value
Home Financials for this Owner
Home Financials are based on the most recent Mortgage that was taken out on this home.
Original Mortgage
$200,000
Outstanding Balance
$171,837
Interest Rate
4.4%
Mortgage Type
New Conventional
Estimated Equity
$210,419
Purchase Details
Closed on
Mar 31, 2005
Sold by
Imperial Homes Texas Ltd
Bought by
Twardowski Jerry L and Twardowski Jodi L
Home Financials for this Owner
Home Financials are based on the most recent Mortgage that was taken out on this home.
Original Mortgage
$131,300
Interest Rate
5.71%
Mortgage Type
Purchase Money Mortgage
Create a Home Valuation Report for This Property
The Home Valuation Report is an in-depth analysis detailing your home's value as well as a comparison with similar homes in the area
Home Values in the Area
Average Home Value in this Area
Purchase History
| Date | Buyer | Sale Price | Title Company |
|---|---|---|---|
| Phan Ngoc B | -- | First American Title | |
| Twardowski Jerry L | -- | Stewart Title Houston Div |
Source: Public Records
Mortgage History
| Date | Status | Borrower | Loan Amount |
|---|---|---|---|
| Open | Phan Ngoc B | $200,000 | |
| Previous Owner | Twardowski Jerry L | $131,300 |
Source: Public Records
Tax History Compared to Growth
Tax History
| Year | Tax Paid | Tax Assessment Tax Assessment Total Assessment is a certain percentage of the fair market value that is determined by local assessors to be the total taxable value of land and additions on the property. | Land | Improvement |
|---|---|---|---|---|
| 2025 | $7,815 | $343,427 | $43,497 | $299,930 |
| 2024 | $7,815 | $338,864 | $43,497 | $295,367 |
| 2023 | $7,815 | $372,865 | $43,497 | $329,368 |
| 2022 | $8,017 | $326,081 | $43,497 | $282,584 |
| 2021 | $6,935 | $267,098 | $37,581 | $229,517 |
| 2020 | $6,814 | $253,441 | $37,581 | $215,860 |
| 2019 | $6,942 | $249,829 | $37,581 | $212,248 |
| 2018 | $3,053 | $238,471 | $37,581 | $200,890 |
| 2017 | $6,708 | $238,471 | $37,581 | $200,890 |
| 2016 | $6,708 | $238,471 | $37,581 | $200,890 |
| 2015 | $5,290 | $238,471 | $37,581 | $200,890 |
| 2014 | $5,290 | $213,993 | $37,581 | $176,412 |
Source: Public Records
Map
Nearby Homes
- 19314 Camellia Bend Cir
- 19610 Vernier Woods Ln
- 19502 Valkyrie Dr
- Ironwood II Plan at Trinity Grove
- Olive III Plan at Trinity Grove
- Cottonwood II Plan at Trinity Grove
- Sequoia II Plan at Trinity Grove
- Hawthorn II Plan at Trinity Grove
- Boxwood III Plan at Trinity Grove
- Hemlock II Plan at Trinity Grove
- Ebony II Plan at Trinity Grove
- Rowan Plan at Trinity Grove
- Cypress II Plan at Trinity Grove
- Plan 264 at Creekwood Crossing
- Plan 217 at Creekwood Crossing
- Plan 210 at Creekwood Crossing
- Plan 270 at Creekwood Crossing
- Plan 218 at Creekwood Crossing
- Plan 265 at Creekwood Crossing
- Plan 269 at Creekwood Crossing
- 19318 Camellia Bend Cir
- 19326 Camellia Bend Cir
- 19334 Camellia Bend Cir
- 19310 Camellia Bend Cir
- 19323 Camellia Bend Cir
- 19327 Camellia Bend Cir
- 19319 Camellia Bend Cir
- 19331 Camellia Bend Cir
- 19315 Camellia Bend Cir
- 19338 Camellia Bend Cir
- 19335 Camellia Bend Cir
- 19406 Wildwood Dale Ln
- 19410 Wildwood Dale Ln
- 19402 Wildwood Dale Ln
- 19311 Camellia Bend Cir
- 19414 Wildwood Dale Ln
- 19339 Camellia Bend Cir
- 19342 Camellia Bend Cir
- 5707 Valley Scene Way
- 5643 Valley Scene Way