C
Seller's Agent in 2017
Chris Goffrier
Cascade Hasson SIR
(541) 383-7600
31 Total Sales
Estimated Value: $1,126,151 - $1,311,000
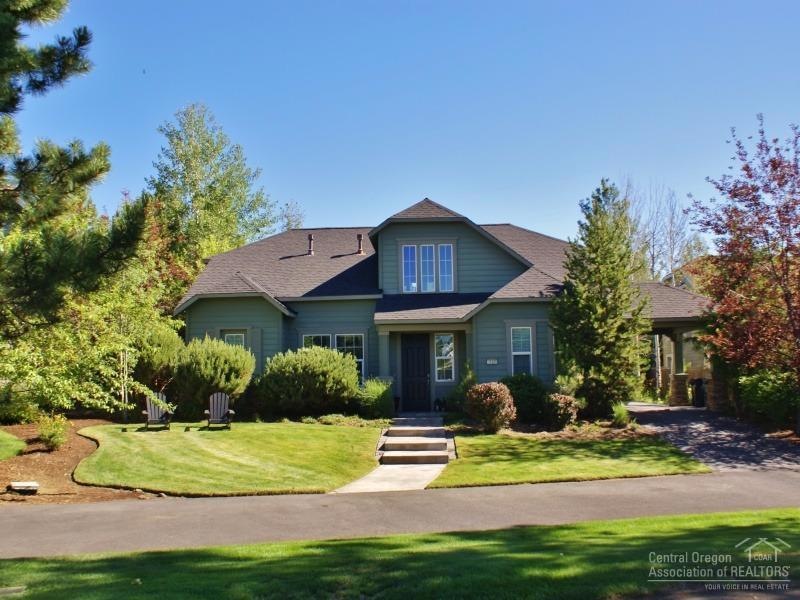
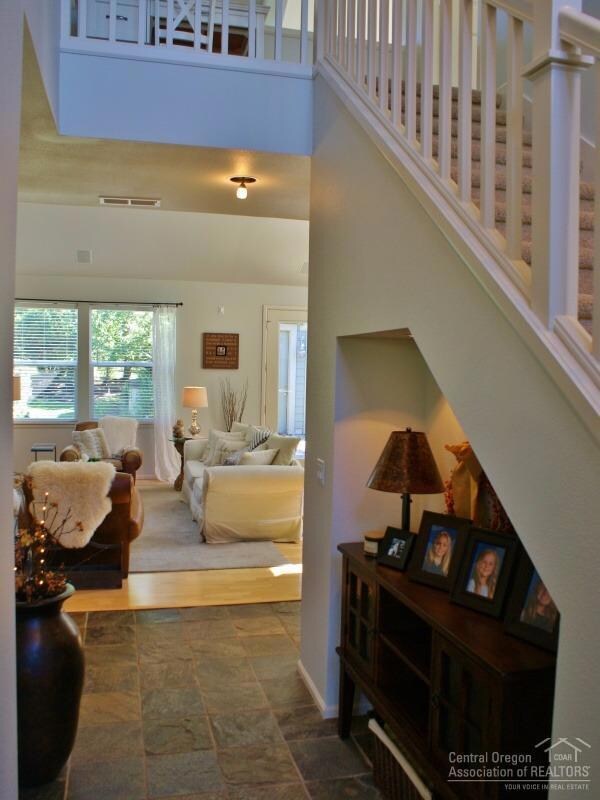
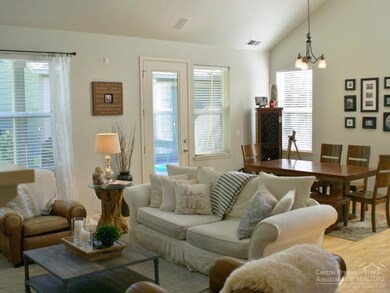
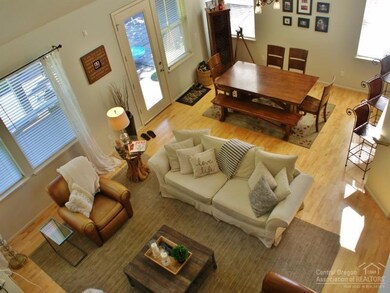
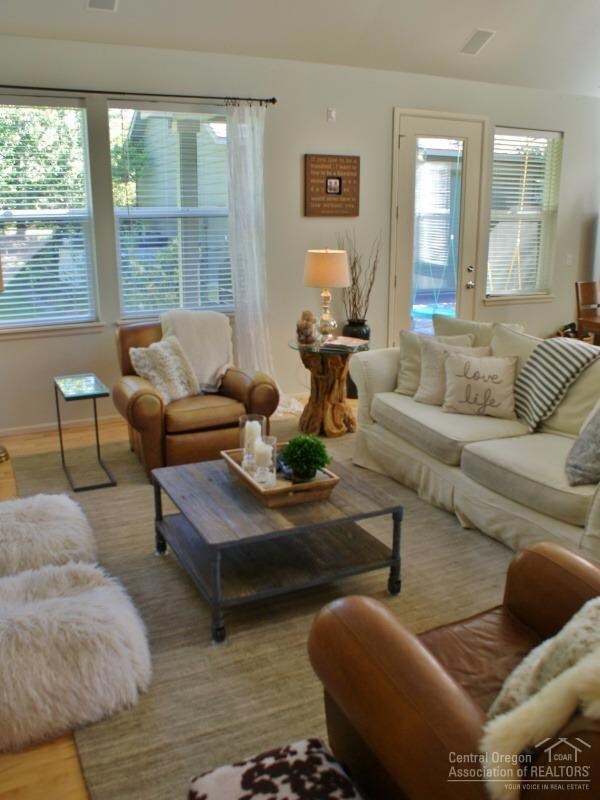
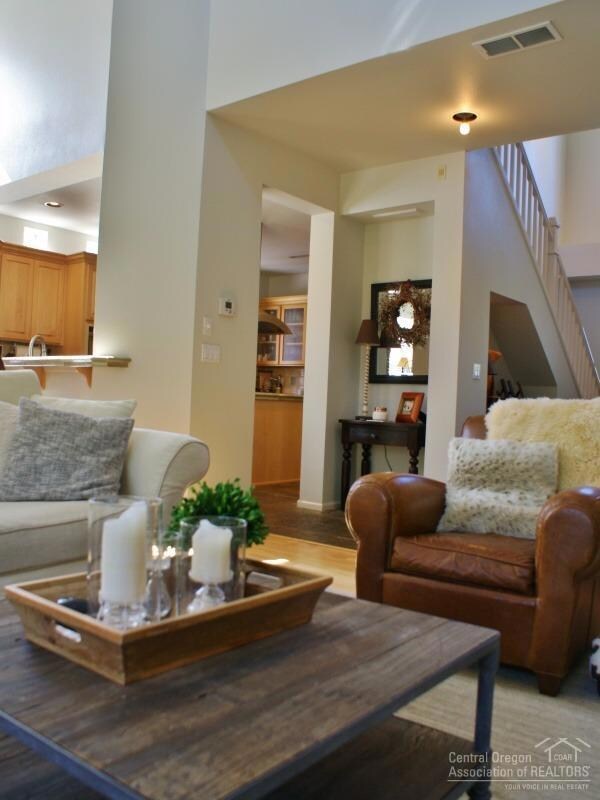
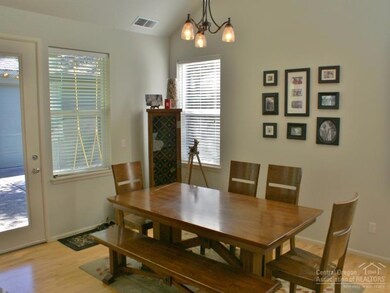
Great main level master home in the highly desirable Parks at Broken Top neighborhood on Bend's west side. Very private larger lot with great backyard including covered BBQ area and hot tub. Open floor plan with main level office/den. Upstairs bedrooms are large and spacious. Home has a long driveway with detached 2-car garage. Neighborhood has 3 large parks with swimming pool, basketball hoop, BBQ area and fountain park. Come enjoy all that this beautiful home and neighborhood has to offer.
Last Agent to Sell the Property
Cascade Hasson SIR License #200603322 Listed on: 09/25/2017

| Date | Buyer | Sale Price | Title Company |
|---|---|---|---|
| Fasan Christopher | $585,000 | First American Title | |
| Cox Jeremy | $480,000 | First American Title | |
| Barron Gregory S | -- | -- |
| Date | Status | Borrower | Loan Amount |
|---|---|---|---|
| Previous Owner | Fasan Christopher | $424,000 | |
| Previous Owner | Cox Jeremy | $360,000 |
| Date | Event | Price | List to Sale | Price per Sq Ft | Prior Sale |
|---|---|---|---|---|---|
| 10/04/2017 10/04/17 | Sold | $585,000 | -2.3% | $218 / Sq Ft | |
| 10/04/2017 10/04/17 | Pending | -- | -- | -- | |
| 06/23/2017 06/23/17 | For Sale | $599,000 | +24.8% | $223 / Sq Ft | |
| 03/24/2015 03/24/15 | Sold | $480,000 | 0.0% | $213 / Sq Ft | View Prior Sale |
| 02/19/2015 02/19/15 | Pending | -- | -- | -- | |
| 02/19/2015 02/19/15 | For Sale | $480,000 | -- | $213 / Sq Ft |
| Year | Tax Paid | Tax Assessment Tax Assessment Total Assessment is a certain percentage of the fair market value that is determined by local assessors to be the total taxable value of land and additions on the property. | Land | Improvement |
|---|---|---|---|---|
| 2025 | $8,089 | $478,720 | -- | -- |
| 2024 | $7,782 | $464,780 | -- | -- |
| 2023 | $7,214 | $451,250 | $0 | $0 |
| 2022 | $6,731 | $425,350 | $0 | $0 |
| 2021 | $6,741 | $412,970 | $0 | $0 |
| 2020 | $6,395 | $412,970 | $0 | $0 |
| 2019 | $6,217 | $400,950 | $0 | $0 |
| 2018 | $6,042 | $389,280 | $0 | $0 |
| 2017 | $5,931 | $377,950 | $0 | $0 |
| 2016 | $5,659 | $366,950 | $0 | $0 |
| 2015 | $5,504 | $356,270 | $0 | $0 |
| 2014 | $5,344 | $345,900 | $0 | $0 |
C
Seller's Agent in 2017
Chris Goffrier
Cascade Hasson SIR
(541) 383-7600
31 Total Sales
R
Buyer's Agent in 2017
Rob Eggers
Duke Warner Realty
(541) 382-8262
4 in this area
109 Total Sales
N
Seller's Agent in 2015
Natalie Vandenborn
Cascade Hasson SIR
Source: Oregon Datashare
MLS Number: 201706162
APN: 198568
Disclaimer: Certain information contained herein is derived from information provided by parties other than Homes.com. All information provided is deemed reliable, but is not guaranteed to be accurate and should be independently verified.
![]() © 2026 Oregon Datashare (KCAR | MLSCO | SOMLS). All rights reserved. The data relating to real estate for sale on this web site comes in part from the Internet Data Exchange Program of the Oregon Datashare. Real estate listings held by IDX Brokerage firms other than Ten-X are marked with the Internet Data Exchange logo or the Internet Data Exchange thumbnail logo and detailed information about them includes the name of the listing Brokers. Information provided is for consumers' personal, non-commercial use and may not be used for any purpose other than to identify prospective properties the viewer may be interested in purchasing. The consumer will not copy, retransmit nor redistribute any of the content from this website. Information provided is deemed reliable, but not guaranteed.
© 2026 Oregon Datashare (KCAR | MLSCO | SOMLS). All rights reserved. The data relating to real estate for sale on this web site comes in part from the Internet Data Exchange Program of the Oregon Datashare. Real estate listings held by IDX Brokerage firms other than Ten-X are marked with the Internet Data Exchange logo or the Internet Data Exchange thumbnail logo and detailed information about them includes the name of the listing Brokers. Information provided is for consumers' personal, non-commercial use and may not be used for any purpose other than to identify prospective properties the viewer may be interested in purchasing. The consumer will not copy, retransmit nor redistribute any of the content from this website. Information provided is deemed reliable, but not guaranteed.
Ask me questions while you tour the home.