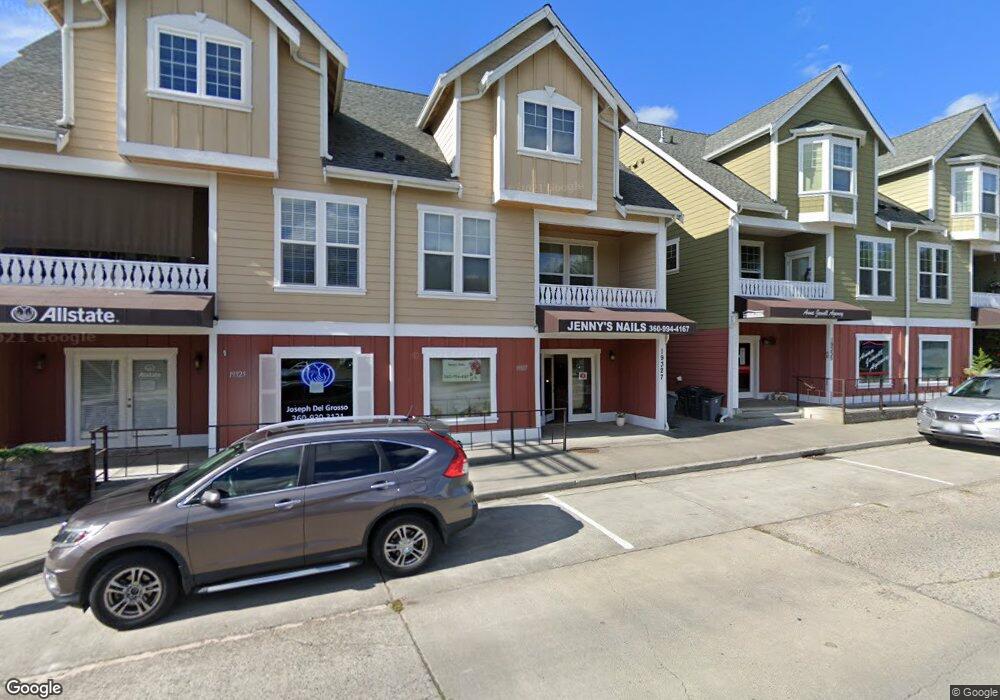
19327 Jensen Way NE Poulsbo, WA 98370
Estimated Value: $588,000 - $704,000
2
Beds
4
Baths
1,316
Sq Ft
$489/Sq Ft
Est. Value
About This Home
This home is located at 19327 Jensen Way NE, Poulsbo, WA 98370 and is currently estimated at $643,930, approximately $489 per square foot. 19327 Jensen Way NE is a home located in Kitsap County with nearby schools including Poulsbo Elementary School, Poulsbo Middle School, and North Kitsap High School.
Ownership History
Date
Name
Owned For
Owner Type
Purchase Details
Closed on
Oct 26, 2006
Sold by
Phase Ii Llc
Bought by
Frame Charles D and Frame Carolyn G
Current Estimated Value
Home Financials for this Owner
Home Financials are based on the most recent Mortgage that was taken out on this home.
Original Mortgage
$41,565
Outstanding Balance
$24,710
Interest Rate
6.3%
Mortgage Type
Unknown
Estimated Equity
$616,029
Purchase Details
Closed on
Oct 19, 2006
Sold by
The Phase Ii Llc
Bought by
Bydalek Maureen
Home Financials for this Owner
Home Financials are based on the most recent Mortgage that was taken out on this home.
Original Mortgage
$41,565
Outstanding Balance
$24,710
Interest Rate
6.3%
Mortgage Type
Unknown
Estimated Equity
$616,029
Create a Home Valuation Report for This Property
The Home Valuation Report is an in-depth analysis detailing your home's value as well as a comparison with similar homes in the area
Home Values in the Area
Average Home Value in this Area
Purchase History
| Date | Buyer | Sale Price | Title Company |
|---|---|---|---|
| Frame Charles D | $415,934 | Pacific Nw Title | |
| Bydalek Maureen | $386,575 | Pacific Nw Title | |
| Bydalek Maureen | -- | Pacific Nw Title |
Source: Public Records
Mortgage History
| Date | Status | Borrower | Loan Amount |
|---|---|---|---|
| Open | Frame Charles D | $41,565 | |
| Open | Frame Charles D | $332,500 | |
| Closed | Bydalek Maureen | $309,036 |
Source: Public Records
Tax History Compared to Growth
Tax History
| Year | Tax Paid | Tax Assessment Tax Assessment Total Assessment is a certain percentage of the fair market value that is determined by local assessors to be the total taxable value of land and additions on the property. | Land | Improvement |
|---|---|---|---|---|
| 2026 | $4,602 | $563,110 | $92,140 | $470,970 |
| 2025 | $4,602 | $512,760 | $92,140 | $420,620 |
| 2024 | $4,417 | $506,780 | $86,160 | $420,620 |
| 2023 | $4,492 | $506,780 | $86,160 | $420,620 |
| 2022 | $3,979 | $426,830 | $74,790 | $352,040 |
| 2021 | $3,847 | $382,480 | $67,010 | $315,470 |
| 2020 | $4,280 | $418,040 | $64,020 | $354,020 |
| 2019 | $3,916 | $382,430 | $49,860 | $332,570 |
| 2018 | $4,423 | $367,030 | $45,330 | $321,700 |
| 2017 | $4,218 | $367,030 | $45,330 | $321,700 |
| 2016 | $4,292 | $344,050 | $45,330 | $298,720 |
| 2015 | $4,127 | $332,570 | $45,330 | $287,240 |
| 2014 | $3,872 | $316,480 | $45,330 | $271,150 |
| 2013 | $3,872 | $316,480 | $45,330 | $271,150 |
Source: Public Records
Map
Nearby Homes
- 123 NE Whimbrel Ln
- 32 NE Sunset St
- 19463 Scoter Ln NE
- 19531 Front St NE
- 19554 Jensen Way NE
- 17602 NE Midnight Sun Loop
- 600 NE Lincoln Rd Unit 41
- 0 7th Ave NE Unit NWM2280996
- 19795 4th Ave NE
- 19809 Ash Crest Loop NE
- 493 NE Lincoln Rd
- 18785 Ness Place NE
- 20249 State Highway 305 NE
- 18637 Fjord Dr NE
- 20065 Regin Ct NE
- 20050 Vikings Crest Loop NE Unit 2-301
- 20145 Vikings Crest Loop NE Unit 3-204
- 21601 Viking Ave NW
- 21133 Viking Ave NW
- 19301 Viking Ave NW
- 19327 Gadwall Ln NE
- 19335 Jensen Way NE
- 19335 Gadwall Ln NE
- 19325 Gadwall Ln NE
- 19337 Jensen Way NE
- 19345 Jensen Way NE
- 19345 Gadwall Ln NE
- 19347 Jensen Way NE
- 163 NE Whimbrel Ln
- 153 NE Whimbrel Ln
- 174 NE Whimbrel Ln
- 19355 Jensen Way NE
- 164 NE Whimbrel Ln
- 19357 Jensen Way NE
- 143 NE Whimbrel Ln
- 154 NE Whimbrel Ln
- 144 NE Whimbrel Ln
- 19365 Jensen Way NE Unit 201
- 175 NE Sunset St
- 19367 Jensen Way NE