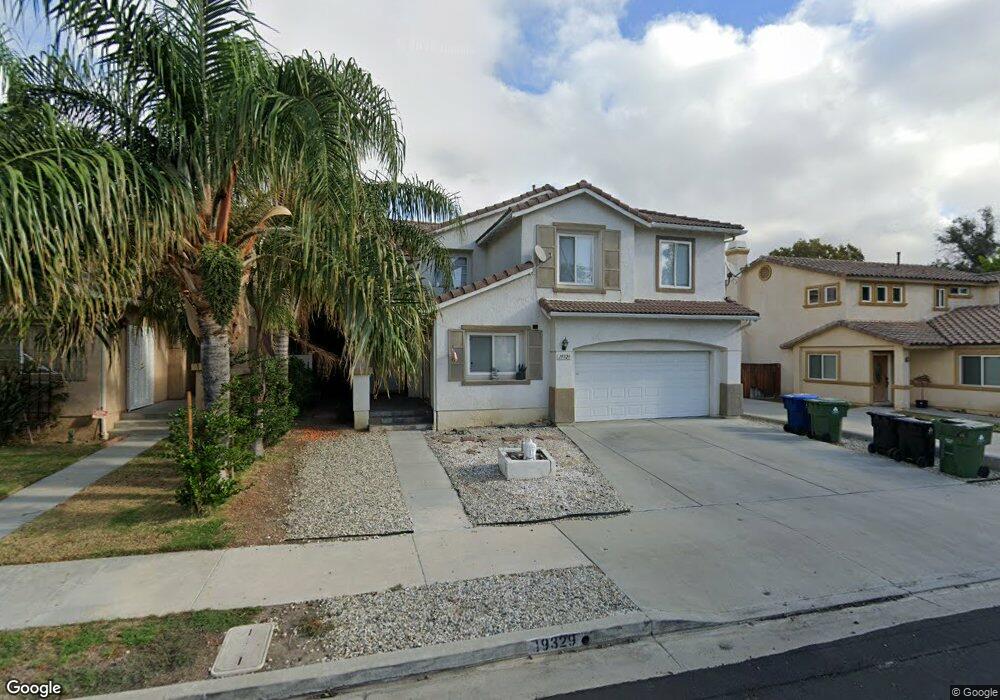
19329 Runnymede St Reseda, CA 91335
Estimated Value: $879,000 - $1,039,000
4
Beds
3
Baths
2,500
Sq Ft
$386/Sq Ft
Est. Value
About This Home
This home is located at 19329 Runnymede St, Reseda, CA 91335 and is currently estimated at $964,727, approximately $385 per square foot. 19329 Runnymede St is a home located in Los Angeles County with nearby schools including Melvin Avenue Elementary School, John A. Sutter Middle School, and Northridge Academy High.
Ownership History
Date
Name
Owned For
Owner Type
Purchase Details
Closed on
Feb 17, 1999
Sold by
R J J Cooper Llc
Bought by
Inman Paula L
Current Estimated Value
Home Financials for this Owner
Home Financials are based on the most recent Mortgage that was taken out on this home.
Original Mortgage
$260,000
Interest Rate
8.99%
Create a Home Valuation Report for This Property
The Home Valuation Report is an in-depth analysis detailing your home's value as well as a comparison with similar homes in the area
Home Values in the Area
Average Home Value in this Area
Purchase History
We collect this data history from publicly available records. To have your information removed, we recommend requesting removal directly through your county’s website.
| Date | Buyer | Sale Price | Title Company |
|---|---|---|---|
| Inman Paula L | $289,500 | Chicago Title Co |
Source: Public Records
Mortgage History
We collect this data history from publicly available records. To have your information removed, we recommend requesting removal directly through your county’s website.
| Date | Status | Borrower | Loan Amount |
|---|---|---|---|
| Previous Owner | Inman Paula L | $260,000 |
Source: Public Records
Tax History
| Year | Tax Paid | Tax Assessment Tax Assessment Total Assessment is a certain percentage of the fair market value that is determined by local assessors to be the total taxable value of land and additions on the property. | Land | Improvement |
|---|---|---|---|---|
| 2025 | $6,219 | $482,626 | $180,890 | $301,736 |
| 2024 | $6,112 | $473,164 | $177,344 | $295,820 |
| 2023 | $5,999 | $463,887 | $173,867 | $290,020 |
| 2022 | $5,729 | $454,792 | $170,458 | $284,334 |
| 2021 | $5,650 | $445,875 | $167,116 | $278,759 |
| 2019 | $5,486 | $432,652 | $162,160 | $270,492 |
| 2018 | $5,355 | $424,170 | $158,981 | $265,189 |
| 2016 | $5,100 | $407,701 | $152,808 | $254,893 |
| 2015 | $5,028 | $401,578 | $150,513 | $251,065 |
| 2014 | $5,051 | $393,712 | $147,565 | $246,147 |
Source: Public Records
Map
Nearby Homes
- 19324 Runnymede St
- 7427 Tunney Ave
- 7514 Beckford Ave
- 7240 Shirley Ave Unit 101
- 19355 Sherman Way Unit 42
- 19431 Sherman Way
- 19431 Sherman Way Unit 6
- 19231 Sherman Way Unit 1
- 7508 Claire Ave
- 19451 Sherman Way Unit 501
- 19545 Sherman Way Unit 17
- 19545 Sherman Way
- 19545 Sherman Way Unit 74
- 7554 Corbin Ave Unit 4
- 7431 Vanalden Ave
- 19350 Sherman Way Unit 338
- 19350 Sherman Way Unit 124
- 19350 Sherman Way Unit 210
- 19531 Keswick St
- 7308 Corbin Ave Unit G
- 7440 Calvin Ave
- 7434 Calvin Ave
- 19345 Runnymede St
- 19352 Cohasset St
- 19341 Runnymede St
- 19344 Cohasset St
- 7443 Calvin Ave
- 19337 Runnymede St
- 7449 Calvin Ave
- 7435 Calvin Ave
- 7430 Calvin Ave
- 19400 Cohasset St
- 19336 Cohasset St
- 19333 Runnymede St
- 19344 Runnymede St
- 19410 Cohasset St
- 7423 Calvin Ave
- 7424 Calvin Ave
- 19330 Cohasset St
- 19411 Runnymede St
Your Personal Tour Guide
Ask me questions while you tour the home.