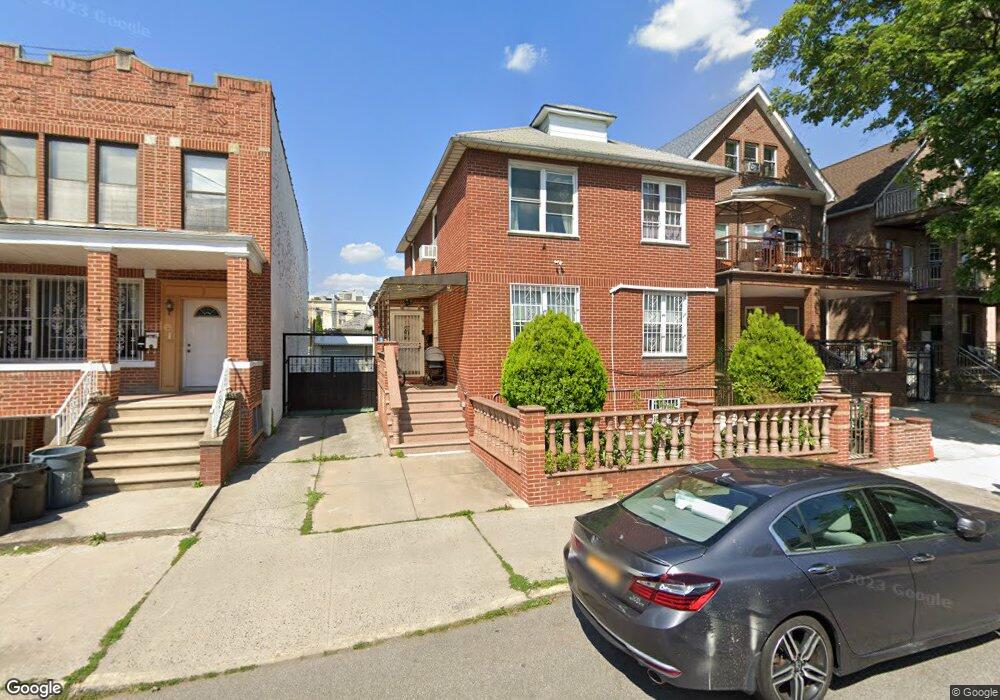
1933 79th St Unit 2 Brooklyn, NY 11214
Bensonhurst NeighborhoodEstimated Value: $1,222,000 - $1,390,000
2
Beds
1
Bath
1,538
Sq Ft
$837/Sq Ft
Est. Value
About This Home
This home is located at 1933 79th St Unit 2, Brooklyn, NY 11214 and is currently estimated at $1,287,787, approximately $837 per square foot. 1933 79th St Unit 2 is a home located in Kings County with nearby schools including P.S. 186 Dr. Irving A. Gladstone Elementary School, Seth Low Intermediate School 96, and New Utrecht High School.
Ownership History
Date
Name
Owned For
Owner Type
Purchase Details
Closed on
Jun 18, 2013
Sold by
Cheung Stanley
Bought by
Cheung As Trustee Pauline and Cheung, As Trustee, Stanley
Current Estimated Value
Purchase Details
Closed on
Feb 19, 1998
Sold by
Catozzi Evelyn
Bought by
Cheung Stanley and Cheung Wai King
Home Financials for this Owner
Home Financials are based on the most recent Mortgage that was taken out on this home.
Original Mortgage
$175,000
Interest Rate
7.11%
Create a Home Valuation Report for This Property
The Home Valuation Report is an in-depth analysis detailing your home's value as well as a comparison with similar homes in the area
Home Values in the Area
Average Home Value in this Area
Purchase History
| Date | Buyer | Sale Price | Title Company |
|---|---|---|---|
| Cheung As Trustee Pauline | -- | -- | |
| Cheung Stanley | -- | -- | |
| Cheung Stanley | $295,000 | Nations Title Insurance |
Source: Public Records
Mortgage History
| Date | Status | Borrower | Loan Amount |
|---|---|---|---|
| Previous Owner | Cheung Stanley | $175,000 |
Source: Public Records
Tax History
| Year | Tax Paid | Tax Assessment Tax Assessment Total Assessment is a certain percentage of the fair market value that is determined by local assessors to be the total taxable value of land and additions on the property. | Land | Improvement |
|---|---|---|---|---|
| 2025 | $10,781 | $68,580 | $21,600 | $46,980 |
| 2024 | $10,781 | $56,220 | $21,600 | $34,620 |
| 2023 | $5,142 | $68,280 | $21,600 | $46,680 |
| 2022 | $4,769 | $61,440 | $21,600 | $39,840 |
| 2021 | $4,943 | $60,000 | $21,600 | $38,400 |
| 2020 | $2,457 | $74,460 | $21,600 | $52,860 |
| 2019 | $9,357 | $74,460 | $21,600 | $52,860 |
| 2018 | $8,602 | $42,200 | $11,897 | $30,303 |
| 2017 | $8,116 | $39,812 | $12,409 | $27,403 |
| 2016 | $7,826 | $39,148 | $15,203 | $23,945 |
| 2015 | $4,310 | $39,148 | $16,582 | $22,566 |
| 2014 | $4,310 | $37,276 | $15,956 | $21,320 |
Source: Public Records
Map
Nearby Homes
Your Personal Tour Guide
Ask me questions while you tour the home.