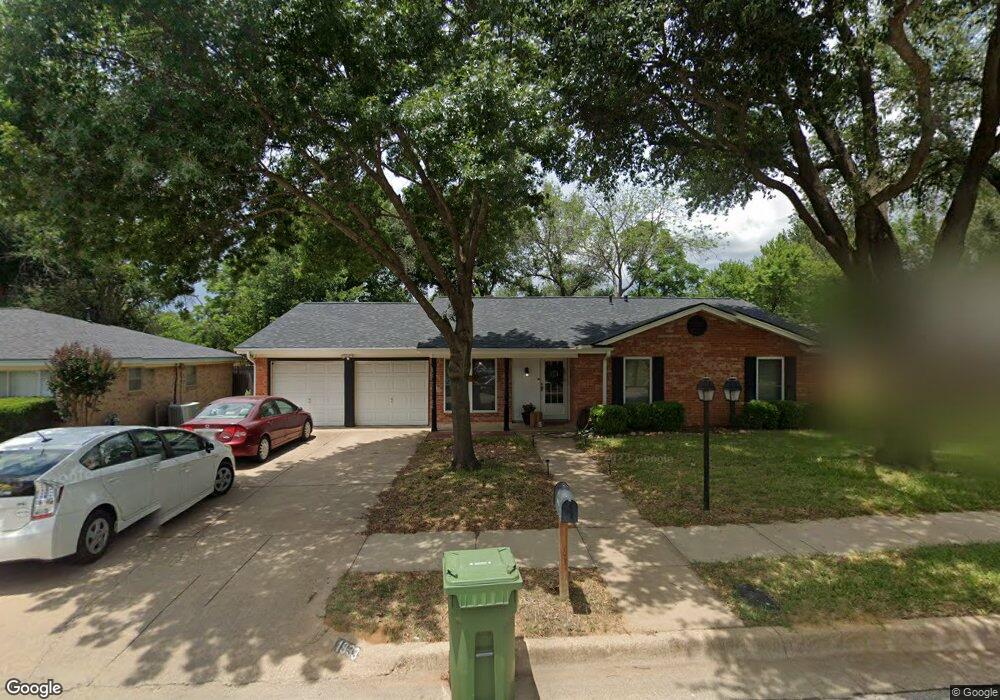
1933 Lexington Place Bedford, TX 76022
Estimated Value: $351,000 - $365,000
4
Beds
2
Baths
1,709
Sq Ft
$208/Sq Ft
Est. Value
About This Home
This home is located at 1933 Lexington Place, Bedford, TX 76022 and is currently estimated at $355,984, approximately $208 per square foot. 1933 Lexington Place is a home located in Tarrant County with nearby schools including Bell Manor Elementary School, Central J High School, and Trinity High School.
Ownership History
Date
Name
Owned For
Owner Type
Purchase Details
Closed on
Nov 9, 2021
Sold by
Skinner Brandyn L and Skinner Molly M
Bought by
Harris Isaac L and Harris Barbara G
Current Estimated Value
Home Financials for this Owner
Home Financials are based on the most recent Mortgage that was taken out on this home.
Original Mortgage
$314,204
Outstanding Balance
$287,994
Interest Rate
3.01%
Mortgage Type
FHA
Estimated Equity
$67,990
Purchase Details
Closed on
Nov 18, 2016
Sold by
Rocket Property Invesment Llc
Bought by
Skinner Brandyn L and Skinner Molly M
Home Financials for this Owner
Home Financials are based on the most recent Mortgage that was taken out on this home.
Original Mortgage
$171,000
Interest Rate
3.42%
Mortgage Type
New Conventional
Purchase Details
Closed on
Aug 16, 2013
Sold by
Hendryx Douglas C and Hendryx Patsy G
Bought by
Rocket Property Investments Llc
Create a Home Valuation Report for This Property
The Home Valuation Report is an in-depth analysis detailing your home's value as well as a comparison with similar homes in the area
Home Values in the Area
Average Home Value in this Area
Purchase History
| Date | Buyer | Sale Price | Title Company |
|---|---|---|---|
| Harris Isaac L | -- | Freedom Title Of Texas | |
| Skinner Brandyn L | -- | Freedom Title Co | |
| Rocket Property Investments Llc | -- | None Available |
Source: Public Records
Mortgage History
| Date | Status | Borrower | Loan Amount |
|---|---|---|---|
| Open | Harris Isaac L | $314,204 | |
| Previous Owner | Skinner Brandyn L | $171,000 |
Source: Public Records
Tax History Compared to Growth
Tax History
| Year | Tax Paid | Tax Assessment Tax Assessment Total Assessment is a certain percentage of the fair market value that is determined by local assessors to be the total taxable value of land and additions on the property. | Land | Improvement |
|---|---|---|---|---|
| 2025 | $3,863 | $260,864 | $65,000 | $195,864 |
| 2024 | $3,863 | $260,864 | $65,000 | $195,864 |
| 2023 | $4,660 | $242,966 | $45,000 | $197,966 |
| 2022 | $5,076 | $232,397 | $45,000 | $187,397 |
| 2021 | $4,704 | $199,698 | $45,000 | $154,698 |
| 2020 | $5,551 | $235,094 | $45,000 | $190,094 |
| 2019 | $5,156 | $236,854 | $45,000 | $191,854 |
| 2018 | $4,305 | $192,936 | $23,000 | $169,936 |
| 2017 | $4,243 | $175,396 | $23,000 | $152,396 |
| 2016 | $3,835 | $158,511 | $23,000 | $135,511 |
| 2015 | $3,252 | $129,500 | $18,000 | $111,500 |
| 2014 | $3,252 | $130,200 | $18,000 | $112,200 |
Source: Public Records
Map
Nearby Homes
- 2024 Charleston Dr
- 2025 Schumac Ln
- 2201 Greendale Ct
- 2101 Gettysburg Place
- 952 Charleston Dr
- 933 Charleston Ct
- 1213 Greendale Dr
- 1701 Winchester Way
- 1613 Trinity Ct
- 1049 Stableway Ln
- 1116 Highpoint Rd
- 804 Natchez Ave
- 828 Gregory Ave
- 2421 Creek Villas Dr
- 1604 Richmond Dr
- 808 Gregory Ave
- 2428 Chestnut Way
- 2420 Dalewood Ln
- 800 Prestwick St
- 1031 Boston Blvd
- 1929 Lexington Place
- 1937 Lexington Place
- 1936 Knoxville Dr
- 1932 Knoxville Dr
- 1940 Knoxville Dr
- 1925 Lexington Place
- 2001 Lexington Place
- 1928 Knoxville Dr
- 1932 Lexington Place
- 1936 Lexington Place
- 1928 Lexington Place
- 2000 Knoxville Dr
- 1924 Knoxville Dr
- 2000 Lexington Place
- 1921 Lexington Place
- 1924 Lexington Place
- 2005 Lexington Place
- 2004 Knoxville Dr
- 1920 Knoxville Dr
- 2004 Lexington Place