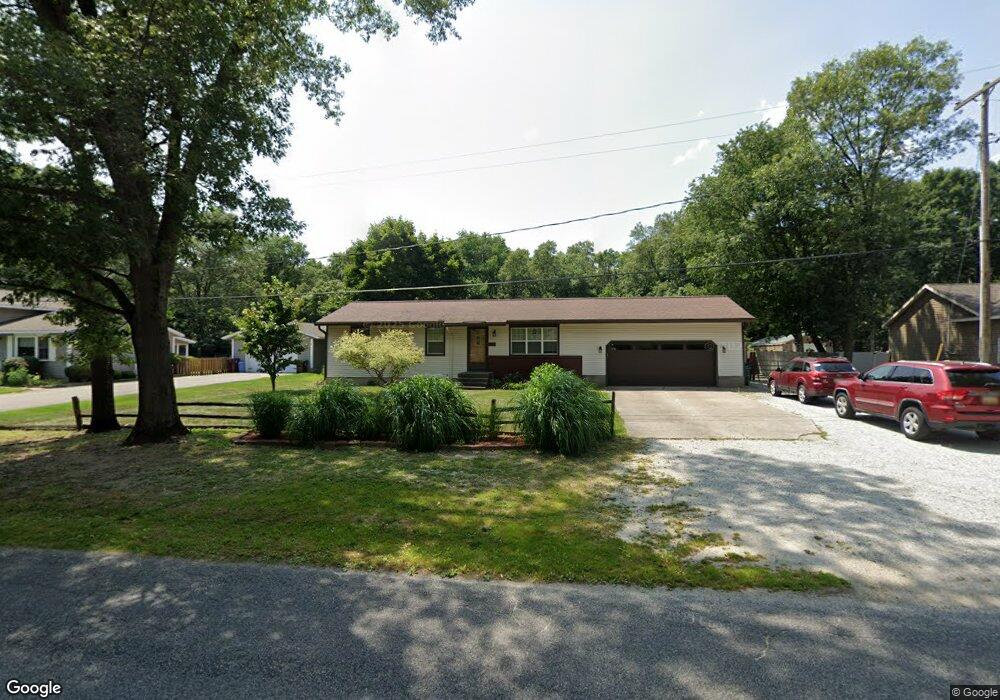
1933 N Sheridan Rd Muskegon, MI 49445
Estimated Value: $299,000 - $335,000
4
Beds
3
Baths
1,056
Sq Ft
$295/Sq Ft
Est. Value
About This Home
This home is located at 1933 N Sheridan Rd, Muskegon, MI 49445 and is currently estimated at $311,198, approximately $294 per square foot. 1933 N Sheridan Rd is a home located in Muskegon County with nearby schools including Reeths-Puffer High School.
Ownership History
Date
Name
Owned For
Owner Type
Purchase Details
Closed on
Nov 9, 2015
Sold by
The M Leon Vanderberg Trust
Bought by
Hartman Robert L and Hartman Lynette M
Current Estimated Value
Purchase Details
Closed on
Apr 20, 2015
Sold by
Smith Katy B
Bought by
Smith Michael L
Purchase Details
Closed on
Sep 10, 2010
Sold by
Wilbur Louis and Wilbur Christine
Bought by
Smith Michael L and Smith Katy B
Home Financials for this Owner
Home Financials are based on the most recent Mortgage that was taken out on this home.
Original Mortgage
$128,170
Interest Rate
4.49%
Mortgage Type
FHA
Purchase Details
Closed on
Feb 5, 2008
Sold by
Hartman Robert and Hartman Lynette
Bought by
Wilbur Louis and Wilbur Christine
Home Financials for this Owner
Home Financials are based on the most recent Mortgage that was taken out on this home.
Original Mortgage
$84,000
Interest Rate
6.11%
Mortgage Type
Unknown
Create a Home Valuation Report for This Property
The Home Valuation Report is an in-depth analysis detailing your home's value as well as a comparison with similar homes in the area
Home Values in the Area
Average Home Value in this Area
Purchase History
| Date | Buyer | Sale Price | Title Company |
|---|---|---|---|
| Hartman Robert L | -- | Premier Lakeshore Title Agen | |
| Smith Michael L | -- | Rei | |
| Smith Michael L | $129,900 | Premier Lakeshore Title Agen | |
| Wilbur Louis | -- | Harbor Title |
Source: Public Records
Mortgage History
| Date | Status | Borrower | Loan Amount |
|---|---|---|---|
| Previous Owner | Smith Michael L | $128,170 | |
| Previous Owner | Wilbur Louis | $84,000 |
Source: Public Records
Tax History Compared to Growth
Tax History
| Year | Tax Paid | Tax Assessment Tax Assessment Total Assessment is a certain percentage of the fair market value that is determined by local assessors to be the total taxable value of land and additions on the property. | Land | Improvement |
|---|---|---|---|---|
| 2025 | $2,822 | $128,000 | $0 | $0 |
| 2024 | $844 | $117,800 | $0 | $0 |
| 2023 | $807 | $101,700 | $0 | $0 |
| 2022 | $2,684 | $92,600 | $0 | $0 |
| 2021 | $2,613 | $86,200 | $0 | $0 |
| 2020 | $2,589 | $82,200 | $0 | $0 |
| 2019 | $2,551 | $77,300 | $0 | $0 |
| 2018 | $2,503 | $75,200 | $0 | $0 |
| 2017 | $2,492 | $72,500 | $0 | $0 |
| 2016 | $717 | $65,300 | $0 | $0 |
| 2015 | -- | $61,400 | $0 | $0 |
| 2014 | -- | $62,800 | $0 | $0 |
| 2013 | -- | $59,600 | $0 | $0 |
Source: Public Records
Map
Nearby Homes
- 2551 Hiawatha Trail
- 2026 N Port Blvd
- 2635 E River Rd
- 1925 Shady Oak Dr
- 1960 Nielwood Dr
- 0 Holton Vl Rd Unit 20027438
- 2337 Northwind Dr
- 2021 Queens Ct
- V/L Holton Rd
- 2624 Holton Rd
- 2960 Holton Rd
- 2060 N Roberts Rd
- 3501 Cedar Rd
- 3480 Hickory Rd
- 3450 Spruce St
- 3475 Spruce St
- 0 E Mcmillan Rd
- 2340 Beech Ln
- 2434 Elm Rd
- 3502 Beech Ln
- 1923 N Sheridan Rd
- 1945 N Sheridan Rd
- 1957 N Sheridan Rd
- 0 N Sheridan Rd
- 1919 N Sheridan Rd
- 1954 N Sheridan Rd
- 1940 N Sheridan Rd
- 1969 N Sheridan Rd
- 1899 N Sheridan Rd
- 1976 N Sheridan Rd
- 2420 Hiawatha Trail
- 1889 N Sheridan Rd
- 1991 N Sheridan Rd
- 2465 Chippewa Trail Unit 30
- 2440 Hiawatha Trail Unit 41
- 1877 N Sheridan Rd
- 2005 N Sheridan Rd
- 2467 Chippewa Trail Unit 29
- 1861 N Sheridan Rd
- 2460 Hiawatha Trail Unit 42