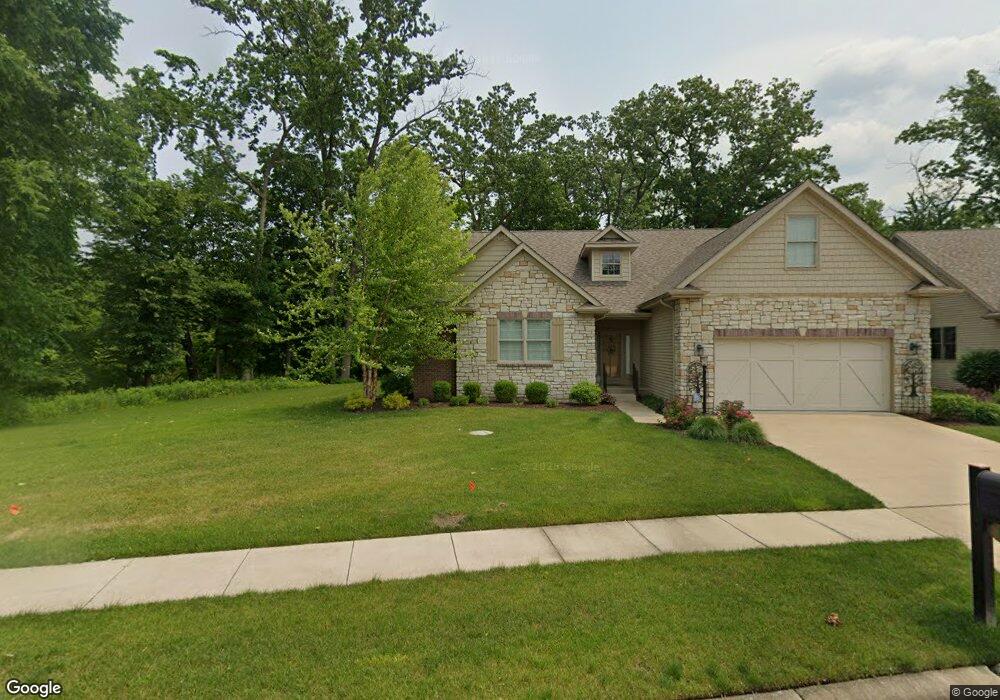
19330 Foley Cir N South Bend, IN 46637
Estimated Value: $404,000 - $657,000
3
Beds
2
Baths
2,003
Sq Ft
$271/Sq Ft
Est. Value
About This Home
This home is located at 19330 Foley Cir N, South Bend, IN 46637 and is currently estimated at $543,309, approximately $271 per square foot. 19330 Foley Cir N is a home located in St. Joseph County with nearby schools including Cora B. Darling Elementary School, Clay Intermediate Center, and Darden Elementary School.
Ownership History
Date
Name
Owned For
Owner Type
Purchase Details
Closed on
Oct 30, 2020
Sold by
Chambliss Linda F
Bought by
Chambliss Trust
Current Estimated Value
Purchase Details
Closed on
Aug 14, 2020
Sold by
Seven Diamonds Llc
Bought by
Chambliss Linda F
Purchase Details
Closed on
Jul 27, 2020
Sold by
Seven Diamonds Llc
Bought by
Chambliss Linda F
Purchase Details
Closed on
Jul 13, 2018
Sold by
Lamb Investment Group Llc
Bought by
Seven Diamonds Llc
Purchase Details
Closed on
Mar 20, 2018
Sold by
Pendle Street Partners Llc
Bought by
Lamb Investment Group Llc
Purchase Details
Closed on
Mar 14, 2018
Sold by
Pendle Street Partners Llc
Bought by
Lamb Investment Group Llc
Create a Home Valuation Report for This Property
The Home Valuation Report is an in-depth analysis detailing your home's value as well as a comparison with similar homes in the area
Home Values in the Area
Average Home Value in this Area
Purchase History
| Date | Buyer | Sale Price | Title Company |
|---|---|---|---|
| Chambliss Trust | -- | None Available | |
| Chambliss Linda F | -- | Fidelity National Title | |
| Chambliss Linda F | -- | Fidelity National Title | |
| Seven Diamonds Llc | -- | None Listed On Document | |
| Lamb Investment Group Llc | -- | New Title Company Name | |
| Lamb Investment Group Llc | -- | New Title Company Name |
Source: Public Records
Tax History Compared to Growth
Tax History
| Year | Tax Paid | Tax Assessment Tax Assessment Total Assessment is a certain percentage of the fair market value that is determined by local assessors to be the total taxable value of land and additions on the property. | Land | Improvement |
|---|---|---|---|---|
| 2024 | $5,149 | $443,400 | $131,500 | $311,900 |
| 2023 | $5,712 | $459,500 | $142,900 | $316,600 |
| 2022 | $5,712 | $462,700 | $142,900 | $319,800 |
| 2021 | $3,814 | $308,500 | $15,900 | $292,600 |
| 2020 | $2,114 | $174,400 | $9,300 | $165,100 |
| 2019 | $61 | $800 | $800 | $0 |
| 2018 | $61 | $800 | $800 | $0 |
| 2017 | $19 | $800 | $800 | $0 |
| 2016 | $19 | $800 | $800 | $0 |
| 2014 | $20 | $800 | $800 | $0 |
Source: Public Records
Map
Nearby Homes
- 53463 Old Woodbridge Ct Unit 6
- 53468 Old Woodbridge Ct Unit 5
- 53434 Old Woodbridge Ct Unit 2
- 125 Myrtle St Unit 20
- 127 David St
- 220 E Pendle St
- 128 Rhode St
- 52912 Francis St
- 324 Weber St
- 52890 Indiana State Route 933 Unit 165
- 53667 Elmhurst St
- 51617 Prescott Ave
- 51670 Prescott Ave
- 51700 Prescott Ave
- 51650 Prescott Ave
- 52724 Ida St
- 126 E Cripe St
- 52650 Hastings St
- 18597 Bracken Fern Ct
- 18476 Summer Wind Ln
- 19330 Foley Cir N Unit 28
- 19326 Foley Cir N
- 19326 Foley Cir N Unit 29
- 19336 Foley Cir N
- 19325 Foley Cir N
- 19316 Foley Cir N
- 19348 Foley Cir N
- 19315 Foley Cir N
- 19310 Foley Cir S
- 19313 Foley Cir S
- 19362 Foley Cir N
- 19375 Foley Cir N Unit 27
- 19375 Foley Cir N
- 19322 Foley Cir S
- 19323 Foley Cir S
- 19339 Foley Cir S
- 19388 Foley Cir N
- 19330 Foley Cir S
- 19355 Foley Cir S
- 53424 Hansel Ln