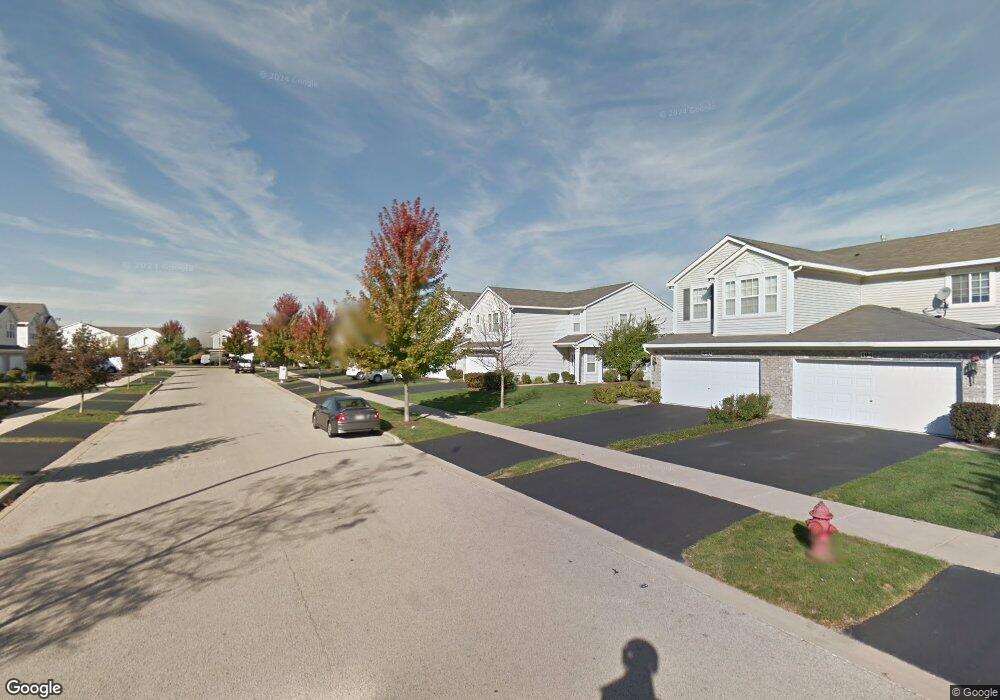
1934 Candlelight Cir Unit 83 Montgomery, IL 60538
Estimated Value: $288,197 - $301,000
3
Beds
3
Baths
1,688
Sq Ft
$175/Sq Ft
Est. Value
About This Home
This home is located at 1934 Candlelight Cir Unit 83, Montgomery, IL 60538 and is currently estimated at $295,299, approximately $174 per square foot. 1934 Candlelight Cir Unit 83 is a home located in Kane County with nearby schools including Bristol Grade School, Autumn Creek Elementary School, and Yorkville Middle School.
Ownership History
Date
Name
Owned For
Owner Type
Purchase Details
Closed on
May 11, 2020
Sold by
Peterson Mary K and Mary K Peterson Revocable Trus
Bought by
Frezados Gail
Current Estimated Value
Home Financials for this Owner
Home Financials are based on the most recent Mortgage that was taken out on this home.
Original Mortgage
$172,800
Outstanding Balance
$153,326
Interest Rate
3.37%
Mortgage Type
New Conventional
Estimated Equity
$141,973
Purchase Details
Closed on
Jul 18, 2011
Sold by
Peterson Mary K
Bought by
Peterson Mary K and Mary K Peterson Revocable Trust
Purchase Details
Closed on
Apr 28, 2006
Sold by
Montalbano Builders Inc
Bought by
Peterson Mary K
Home Financials for this Owner
Home Financials are based on the most recent Mortgage that was taken out on this home.
Original Mortgage
$171,000
Interest Rate
6.54%
Mortgage Type
Fannie Mae Freddie Mac
Create a Home Valuation Report for This Property
The Home Valuation Report is an in-depth analysis detailing your home's value as well as a comparison with similar homes in the area
Home Values in the Area
Average Home Value in this Area
Purchase History
| Date | Buyer | Sale Price | Title Company |
|---|---|---|---|
| Frezados Gail | $192,000 | Fidelity National Title Ins | |
| Peterson Mary K | -- | None Available | |
| Peterson Mary K | $214,500 | Chicago Title Insurance Comp |
Source: Public Records
Mortgage History
| Date | Status | Borrower | Loan Amount |
|---|---|---|---|
| Open | Frezados Gail | $172,800 | |
| Closed | Peterson Mary K | $171,000 |
Source: Public Records
Tax History
| Year | Tax Paid | Tax Assessment Tax Assessment Total Assessment is a certain percentage of the fair market value that is determined by local assessors to be the total taxable value of land and additions on the property. | Land | Improvement |
|---|---|---|---|---|
| 2024 | $5,583 | $73,108 | $11,006 | $62,102 |
| 2023 | $5,339 | $65,934 | $9,926 | $56,008 |
| 2022 | $5,370 | $60,870 | $9,164 | $51,706 |
| 2021 | $5,177 | $57,927 | $8,721 | $49,206 |
| 2020 | $4,484 | $56,691 | $8,535 | $48,156 |
| 2019 | $4,732 | $54,838 | $8,256 | $46,582 |
| 2018 | $4,482 | $53,066 | $9,411 | $43,655 |
| 2017 | $4,358 | $50,679 | $8,988 | $41,691 |
| 2016 | $5,047 | $50,544 | $8,592 | $41,952 |
| 2015 | -- | $47,026 | $7,994 | $39,032 |
| 2014 | -- | $44,967 | $7,644 | $37,323 |
| 2013 | -- | $45,439 | $7,724 | $37,715 |
Source: Public Records
Map
Nearby Homes
- 1853 Candlelight Cir Unit 183
- 1851 Simpson Ct
- 3014 Shetland Ln
- 2101 Chad Ln
- 2978 Fairfield Way
- 2914 Meadowview Ln
- 4620 Plymouth Ave
- 968 Sapphire Ln
- 971 Sapphire Ln
- 983 Sapphire Ln
- 984 Sapphire Ln
- 972 Sapphire Ln
- 980 Sapphire Ln
- 988 Sapphire Ln
- 3108 Manchester Dr
- 3051 Patterson Rd
- 201 Barrett Dr Unit A
- 2031 Matthew Dr Unit 1
- 2626 Cielo Ct
- 3340 Cloud Croft Ct
- 1912 Candlelight Cir Unit 62
- 1930 Candlelight Cir Unit 81
- 1926 Candlelight Cir Unit 74
- 1920 Candlelight Cir Unit 71
- 1924 Candlelight Cir Unit 73
- 1922 Candlelight Cir Unit 72
- 1932 Candlelight Cir Unit 82
- 1914 Candlelight Cir Unit 63
- 1904 Candlelight Cir Unit 53
- 1910 Candlelight Cir Unit 61
- 1916 Candlelight Cir Unit 64
- 1930 Candlelight Cir Unit 1930
- 1924 Candlelight Cir Unit 1924
- 1930 Candlelight Cir Unit 1930
- 1934 Candlelight Cir
- 1940 Candlelight Cir Unit 91
- 1944 Candlelight Cir Unit 93
- 1942 Candlelight Cir Unit 92
- 1937 Candlelight Cir Unit 231
- 1931 Candlelight Cir Unit 234
Your Personal Tour Guide
Ask me questions while you tour the home.