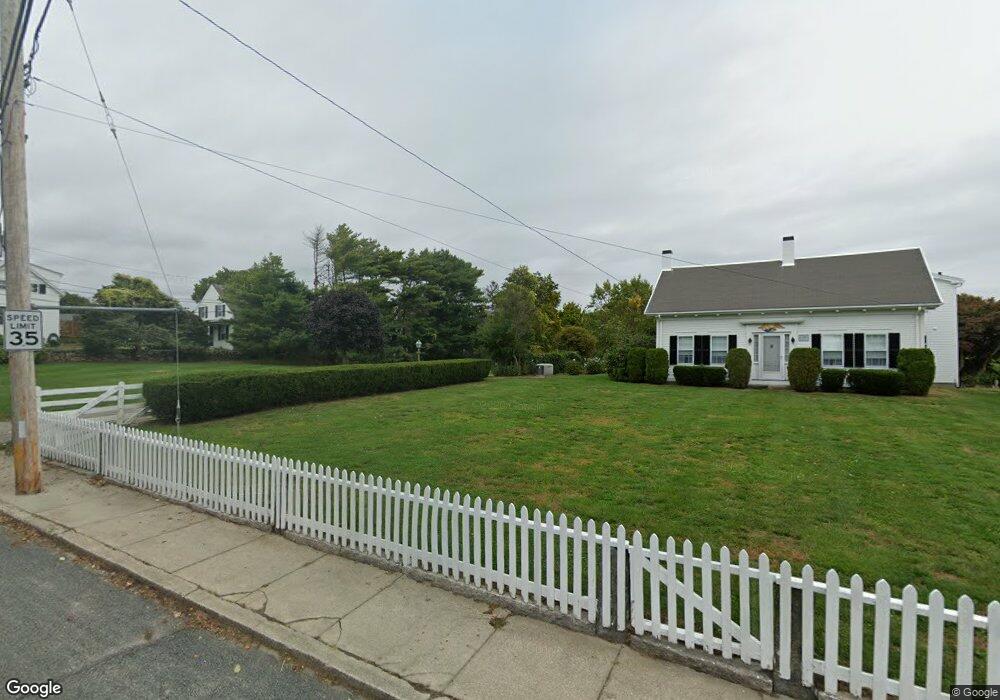
1934 Main Rd Westport Point, MA 02791
Westport Point NeighborhoodEstimated Value: $662,000 - $934,000
3
Beds
--
Bath
1,001
Sq Ft
$804/Sq Ft
Est. Value
About This Home
This home is located at 1934 Main Rd, Westport Point, MA 02791 and is currently estimated at $805,193, approximately $804 per square foot. 1934 Main Rd is a home with nearby schools including Alice A. Macomber Primary School, Westport Elementary School, and Westport Middle-High School.
Ownership History
Date
Name
Owned For
Owner Type
Purchase Details
Closed on
Oct 14, 1999
Sold by
Boutwell Mary Lou
Bought by
Chadwick Whitney and Bechtle Robert A
Current Estimated Value
Home Financials for this Owner
Home Financials are based on the most recent Mortgage that was taken out on this home.
Original Mortgage
$150,000
Outstanding Balance
$44,401
Interest Rate
7.8%
Mortgage Type
Purchase Money Mortgage
Estimated Equity
$760,792
Purchase Details
Closed on
Oct 11, 1996
Sold by
Charles E Nelson Sr Nt
Bought by
Boutwell Marylou
Home Financials for this Owner
Home Financials are based on the most recent Mortgage that was taken out on this home.
Original Mortgage
$175,500
Interest Rate
8.06%
Mortgage Type
Purchase Money Mortgage
Purchase Details
Closed on
Aug 15, 1989
Sold by
Werner Donald C
Bought by
Kelly Martin J
Purchase Details
Closed on
Oct 6, 1988
Sold by
Werner Donald C
Bought by
Campbell Peter G
Purchase Details
Closed on
Nov 24, 1987
Sold by
Werner Donald C
Bought by
Harty Mark P
Create a Home Valuation Report for This Property
The Home Valuation Report is an in-depth analysis detailing your home's value as well as a comparison with similar homes in the area
Home Values in the Area
Average Home Value in this Area
Purchase History
| Date | Buyer | Sale Price | Title Company |
|---|---|---|---|
| Chadwick Whitney | $320,000 | -- | |
| Chadwick Whitney | $320,000 | -- | |
| Boutwell Marylou | $195,000 | -- | |
| Boutwell Marylou | $195,000 | -- | |
| Kelly Martin J | $157,500 | -- | |
| Campbell Peter G | $165,000 | -- | |
| Harty Mark P | $220,000 | -- |
Source: Public Records
Mortgage History
| Date | Status | Borrower | Loan Amount |
|---|---|---|---|
| Open | Harty Mark P | $150,000 | |
| Closed | Harty Mark P | $150,000 | |
| Previous Owner | Harty Mark P | $175,500 |
Source: Public Records
Tax History Compared to Growth
Tax History
| Year | Tax Paid | Tax Assessment Tax Assessment Total Assessment is a certain percentage of the fair market value that is determined by local assessors to be the total taxable value of land and additions on the property. | Land | Improvement |
|---|---|---|---|---|
| 2025 | $5,602 | $752,000 | $606,400 | $145,600 |
| 2024 | $5,202 | $672,900 | $529,200 | $143,700 |
| 2023 | $4,941 | $605,500 | $472,900 | $132,600 |
| 2022 | $4,587 | $540,900 | $423,100 | $117,800 |
| 2021 | $4,185 | $485,500 | $367,700 | $117,800 |
| 2020 | $3,968 | $470,700 | $352,900 | $117,800 |
| 2019 | $3,680 | $445,000 | $336,700 | $108,300 |
| 2018 | $3,822 | $467,800 | $361,900 | $105,900 |
| 2017 | $3,710 | $465,500 | $361,900 | $103,600 |
| 2016 | $3,654 | $462,000 | $361,900 | $100,100 |
| 2015 | $3,649 | $460,100 | $373,600 | $86,500 |
Source: Public Records
Map
Nearby Homes
- 1881 Main Rd
- 1749 Main Rd
- 1702J Drift Rd
- 1702 Drift Rd
- 1580 Main Rd
- 19 Seabury Ln
- 1346 Main Rd Unit B
- 99 Sylvia Ln
- 238-242 E Beach Rd
- 189 Brayton Point Rd
- 304 Brayton Point Rd
- 255 John Dyer Rd
- Lot 2 Horseneck Rd
- 225 Hixbridge Rd
- 245 John Dyer Rd
- 920 Drift Rd
- 17 Quail Trail
- 101 Adamsville Rd
- Lot 2E Horseneck Rd
- 837 Main Rd
- 1878 Drift Rd
- 1936 Main Rd
- 0 Main Rd Unit 72396824
- 0 Main Rd Unit 72396812
- 0 Main Rd Unit 72368311
- 0 Main Rd Unit 72335084
- 0 Main Rd Unit 70762097
- 0 Main Rd Unit 70846327
- 0 Main Rd Unit 71182376
- 0 Main Rd Unit 71362488
- 0 Main Rd Unit 71451305
- 0 Main Rd Unit 71774355
- 0 Main Rd Unit 71903310
- 0 Main Rd Unit 72099121
- 0 Main Rd Unit 70551656
- 0 Main Rd Unit 70395724
- 1807-1809 Main Rd
- 0 Main Rd Unit 960005
- 0 Main Rd Unit 1022217
- 0 Main Rd Unit 1198013