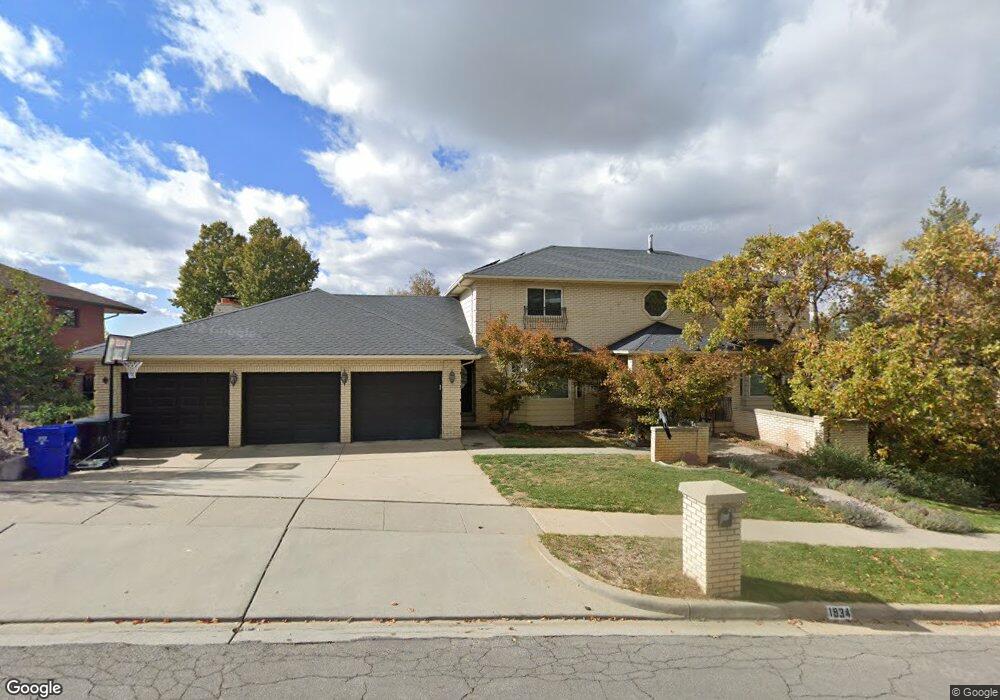
1934 S 850 E Bountiful, UT 84010
Estimated Value: $867,000 - $1,049,000
7
Beds
4
Baths
6,794
Sq Ft
$138/Sq Ft
Est. Value
About This Home
This home is located at 1934 S 850 E, Bountiful, UT 84010 and is currently estimated at $939,466, approximately $138 per square foot. 1934 S 850 E is a home located in Davis County with nearby schools including Muir School, Mueller Park Junior High School, and Bountiful High School.
Ownership History
Date
Name
Owned For
Owner Type
Purchase Details
Closed on
Jun 15, 2009
Sold by
Monson Sean A
Bought by
Monson Sean A and Monson Jana L
Current Estimated Value
Home Financials for this Owner
Home Financials are based on the most recent Mortgage that was taken out on this home.
Original Mortgage
$397,600
Interest Rate
4.48%
Mortgage Type
New Conventional
Purchase Details
Closed on
May 25, 2007
Sold by
Grandia Glenna H and Grandia Larry D
Bought by
Monson Sean A
Home Financials for this Owner
Home Financials are based on the most recent Mortgage that was taken out on this home.
Original Mortgage
$376,000
Interest Rate
5.86%
Mortgage Type
Purchase Money Mortgage
Purchase Details
Closed on
Aug 1, 2002
Sold by
Grandia Glenna H and Grandia Larry D
Bought by
Grandia Glenna H and Grandia Larry D
Create a Home Valuation Report for This Property
The Home Valuation Report is an in-depth analysis detailing your home's value as well as a comparison with similar homes in the area
Purchase History
| Date | Buyer | Sale Price | Title Company |
|---|---|---|---|
| Monson Sean A | -- | Equity Title Ins Agency Inc | |
| Monson Sean A | -- | Guardian Title Company | |
| Grandia Glenna H | -- | -- |
Source: Public Records
Mortgage History
| Date | Status | Borrower | Loan Amount |
|---|---|---|---|
| Closed | Monson Sean A | $397,600 | |
| Previous Owner | Monson Sean A | $376,000 |
Source: Public Records
Tax History
| Year | Tax Paid | Tax Assessment Tax Assessment Total Assessment is a certain percentage of the fair market value that is determined by local assessors to be the total taxable value of land and additions on the property. | Land | Improvement |
|---|---|---|---|---|
| 2025 | $4,879 | $455,950 | $136,331 | $319,619 |
| 2024 | $4,553 | $437,801 | $125,659 | $312,142 |
| 2023 | $4,593 | $802,000 | $228,341 | $573,659 |
| 2022 | $4,792 | $459,250 | $121,659 | $337,591 |
| 2021 | $4,243 | $622,000 | $180,863 | $441,137 |
| 2020 | $3,739 | $551,000 | $164,675 | $386,325 |
| 2019 | $3,798 | $547,000 | $161,107 | $385,893 |
| 2018 | $4,108 | $587,000 | $149,809 | $437,191 |
| 2016 | $3,424 | $264,495 | $48,286 | $216,209 |
| 2015 | $3,545 | $259,325 | $48,286 | $211,039 |
| 2014 | $3,368 | $248,177 | $48,286 | $199,891 |
| 2013 | -- | $191,400 | $59,840 | $131,560 |
Source: Public Records
Map
Nearby Homes
- 842 E 2150 S
- 2136 Elaine Dr
- 626 E 2150 S
- 1087 Arlington Way
- 631 E 1700 S
- 1886 S Jeri Dr
- 438 E 1800 S
- 2059 S 350 E Unit 6
- 2038 S 350 E Unit 3
- 2046 S 350 E Unit 4
- 320 E 2100 S
- 795 Abby Ln Unit 5
- 291 E 1950 S
- 0 Bountiful Blvd
- 288 E 1650 S
- 380 E 1500 S
- 188 E 2050 S Unit D3
- 861 E Millbrook Way
- 1475 Mueller Park Rd
- 1785 1450 E Unit 604
Your Personal Tour Guide
Ask me questions while you tour the home.