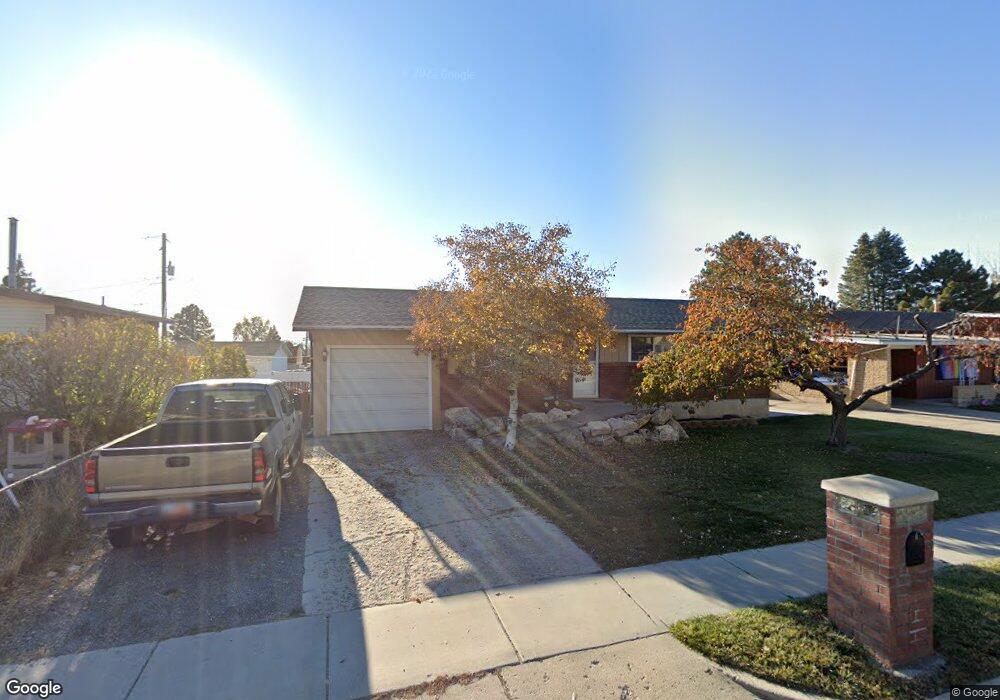
1935 Matthew Dr Layton, UT 84041
Estimated Value: $396,000 - $491,000
4
Beds
3
Baths
1,025
Sq Ft
$427/Sq Ft
Est. Value
About This Home
This home is located at 1935 Matthew Dr, Layton, UT 84041 and is currently estimated at $437,433, approximately $426 per square foot. 1935 Matthew Dr is a home located in Davis County with nearby schools including Vae View Elementary School, Central Davis Junior High School, and Layton High School.
Ownership History
Date
Name
Owned For
Owner Type
Purchase Details
Closed on
Mar 5, 2018
Sold by
Coburn Sharon and Coburn Kirk
Bought by
Stringham Phillip and Stringham Rachel
Current Estimated Value
Home Financials for this Owner
Home Financials are based on the most recent Mortgage that was taken out on this home.
Original Mortgage
$140,000
Outstanding Balance
$80,201
Interest Rate
4.22%
Mortgage Type
New Conventional
Estimated Equity
$357,232
Purchase Details
Closed on
Jan 13, 2011
Sold by
Coburn Kirk M and Coburn Teresa E
Bought by
Coburn Kirk M
Home Financials for this Owner
Home Financials are based on the most recent Mortgage that was taken out on this home.
Original Mortgage
$85,891
Interest Rate
4.62%
Mortgage Type
New Conventional
Purchase Details
Closed on
Sep 5, 1999
Sold by
Highfill Jerry E and Highfill Helen C
Bought by
Coburn Kirk M and Coburn Teresa E
Home Financials for this Owner
Home Financials are based on the most recent Mortgage that was taken out on this home.
Original Mortgage
$94,223
Interest Rate
7.66%
Mortgage Type
FHA
Create a Home Valuation Report for This Property
The Home Valuation Report is an in-depth analysis detailing your home's value as well as a comparison with similar homes in the area
Home Values in the Area
Average Home Value in this Area
Purchase History
| Date | Buyer | Sale Price | Title Company |
|---|---|---|---|
| Stringham Phillip | -- | Us Title | |
| Coburn Kirk M | -- | First American Title | |
| Coburn Kirk M | -- | Avis & Archibald Title |
Source: Public Records
Mortgage History
| Date | Status | Borrower | Loan Amount |
|---|---|---|---|
| Open | Stringham Phillip | $140,000 | |
| Previous Owner | Coburn Kirk M | $85,891 | |
| Previous Owner | Coburn Kirk M | $94,223 |
Source: Public Records
Tax History
| Year | Tax Paid | Tax Assessment Tax Assessment Total Assessment is a certain percentage of the fair market value that is determined by local assessors to be the total taxable value of land and additions on the property. | Land | Improvement |
|---|---|---|---|---|
| 2025 | $2,117 | $222,200 | $122,393 | $99,807 |
| 2024 | $2,039 | $215,600 | $145,704 | $69,896 |
| 2023 | $1,991 | $371,000 | $176,947 | $194,053 |
| 2022 | $2,108 | $213,401 | $86,015 | $127,386 |
| 2021 | $1,928 | $291,000 | $126,849 | $164,151 |
| 2020 | $1,623 | $235,000 | $95,904 | $139,096 |
| 2019 | $1,622 | $230,000 | $92,218 | $137,782 |
| 2018 | $1,412 | $201,000 | $85,387 | $115,613 |
| 2016 | $1,229 | $90,310 | $23,373 | $66,937 |
| 2015 | $1,183 | $82,500 | $23,373 | $59,127 |
| 2014 | $1,184 | $84,421 | $23,373 | $61,048 |
| 2013 | -- | $77,729 | $21,735 | $55,994 |
Source: Public Records
Map
Nearby Homes
- 1847 John St
- 1740 N Gregory Dr
- 1896 Cliff Place
- 1916 N Celia Way
- 1870 N Celia Way
- 1648 W 1920 N
- 1707 N 1625 W
- 1711 N 1625 W
- 1713 N 1625 W
- 1650 N Main St
- 1650 N Main St Unit 126
- 1748 N 1600 W
- 1740 N 1600 W Unit 116
- 1883 W 1575 N
- 1696 N 1600 W
- 1858 W 1575 N Unit 240
- 1858 W 1575 N
- 1692 N 1600 W
- 1888 W 1575 N Unit 235
- 1888 W 1575 N
- 1945 Matthew Dr
- 1903 Matthew Dr
- 1872 Ann St
- 1860 Ann St
- 1955 Matthew Dr
- 1888 Ann St
- 1876 N Gregory Dr
- 1862 N Gregory Dr
- 1900 Ann St
- 1934 Matthew Dr
- 1892 N Gregory Dr
- 1892 N Gregory Dr Unit 142
- 1942 Matthew Dr
- 1904 Matthew Dr
- 1973 Matthew Dr
- 1952 Matthew Dr
- 1874 Matthew Dr
- 1920 Ann St
- 1854 N Gregory Dr
- 1853 Ann St
Your Personal Tour Guide
Ask me questions while you tour the home.