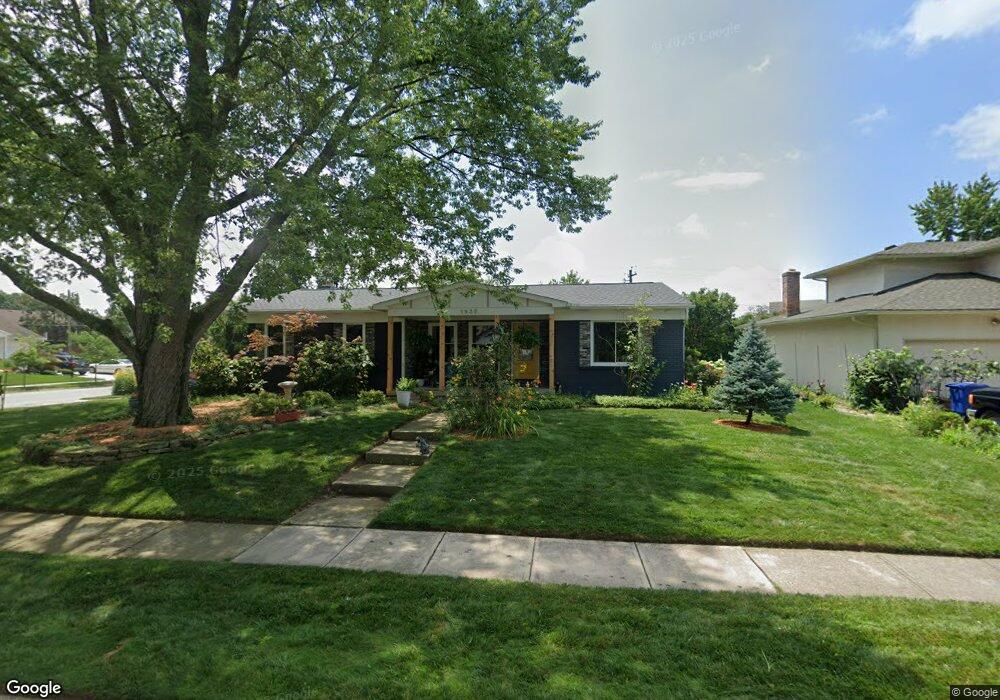
1935 Wilmington Place Columbus, OH 43220
Northcrest NeighborhoodEstimated Value: $411,000 - $468,000
3
Beds
2
Baths
1,879
Sq Ft
$227/Sq Ft
Est. Value
About This Home
This home is located at 1935 Wilmington Place, Columbus, OH 43220 and is currently estimated at $427,042, approximately $227 per square foot. 1935 Wilmington Place is a home located in Franklin County with nearby schools including Winterset Elementary School, Ridgeview Middle School, and Centennial High School.
Ownership History
Date
Name
Owned For
Owner Type
Purchase Details
Closed on
Oct 26, 2009
Sold by
Fox Patrice A and Estate Of Robert Roll
Bought by
Simpson Jason and Simpson Star L
Current Estimated Value
Home Financials for this Owner
Home Financials are based on the most recent Mortgage that was taken out on this home.
Original Mortgage
$176,739
Outstanding Balance
$115,816
Interest Rate
5.07%
Mortgage Type
FHA
Estimated Equity
$311,226
Purchase Details
Closed on
Jan 1, 2000
Sold by
Schonaner Debra
Bought by
Roll Robert
Purchase Details
Closed on
Aug 24, 1999
Sold by
Miller Raya J
Bought by
Roll Robert
Purchase Details
Closed on
Aug 10, 1999
Sold by
Luft Todd
Bought by
Roll Robert
Purchase Details
Closed on
Jun 22, 1999
Sold by
Crawford Callendar Tamara
Bought by
Roll Robert
Purchase Details
Closed on
Apr 27, 1999
Sold by
Estate Of Mary Y Roll
Bought by
Roll Robert and Miller Raya J
Purchase Details
Closed on
Jun 22, 1979
Bought by
Roll Robert E
Create a Home Valuation Report for This Property
The Home Valuation Report is an in-depth analysis detailing your home's value as well as a comparison with similar homes in the area
Home Values in the Area
Average Home Value in this Area
Purchase History
| Date | Buyer | Sale Price | Title Company |
|---|---|---|---|
| Simpson Jason | $180,000 | Attorney | |
| Roll Robert | -- | -- | |
| Roll Robert | -- | -- | |
| Roll Robert | -- | -- | |
| Roll Robert | -- | -- | |
| Roll Robert | -- | -- | |
| Roll Robert E | $67,500 | -- |
Source: Public Records
Mortgage History
| Date | Status | Borrower | Loan Amount |
|---|---|---|---|
| Open | Simpson Jason | $176,739 |
Source: Public Records
Tax History Compared to Growth
Tax History
| Year | Tax Paid | Tax Assessment Tax Assessment Total Assessment is a certain percentage of the fair market value that is determined by local assessors to be the total taxable value of land and additions on the property. | Land | Improvement |
|---|---|---|---|---|
| 2024 | $5,241 | $116,770 | $48,760 | $68,010 |
| 2023 | $5,174 | $116,760 | $48,755 | $68,005 |
| 2022 | $4,810 | $92,750 | $30,730 | $62,020 |
| 2021 | $4,819 | $92,750 | $30,730 | $62,020 |
| 2020 | $4,825 | $92,750 | $30,730 | $62,020 |
| 2019 | $4,618 | $76,130 | $24,570 | $51,560 |
| 2018 | $4,165 | $76,130 | $24,570 | $51,560 |
| 2017 | $4,358 | $76,130 | $24,570 | $51,560 |
| 2016 | $4,100 | $61,890 | $14,880 | $47,010 |
| 2015 | $3,722 | $61,890 | $14,880 | $47,010 |
| 2014 | $3,731 | $61,890 | $14,880 | $47,010 |
| 2013 | $1,753 | $58,940 | $14,175 | $44,765 |
Source: Public Records
Map
Nearby Homes
- 1865 Willoway Cir N Unit 1865
- 1835 Willoway Cir N
- 4924 Reed Rd Unit B
- 1739 Paula Dr Unit 1739
- 4740 Merrifield Place Unit 25
- 5268 Captains Ct
- 2165 Partlow Dr
- 5111 Schuylkill St
- 2172 Hedgerow Rd Unit 2172G
- 2198 Sandston Rd
- 4781 Coach Rd
- 5111 Portland St
- 2231 Atlee Ct Unit 12
- 1558 Denbigh Dr
- 2179 Victoria Park Dr Unit 2179
- 5283 Ruthton Rd Unit 19
- 2248 Sandover Rd
- 2236 Victoria Park Dr Unit 2236
- 1466 Weybridge Rd
- 1594 Lafayette Dr Unit 1594
- 1943 Wilmington Place
- 4974 Willoway Ct S
- 4976 Willoway Ct E
- 4978 Willoway Ct E
- 4970 Willoway Ct E Unit 4970
- 4972 Willoway Ct E Unit 4972
- 1955 Wilmington Place
- 4968 Willoway Ct E Unit 4968
- 4976 Gettysburg Rd
- 5007 Gettysburg Rd
- 4988 Gettysburg Rd
- 4973 Willoway Ct E
- 4960 Willoway Ct E
- 4962 Willoway Ct E
- 4971 Willoway Ct E
- 4964 Willoway Ct E
- 1948 Wilmington Place
- 4994 Gettysburg Rd
- 1980 Willoway Ct N Unit 1980
- 4969 Willoway Ct E