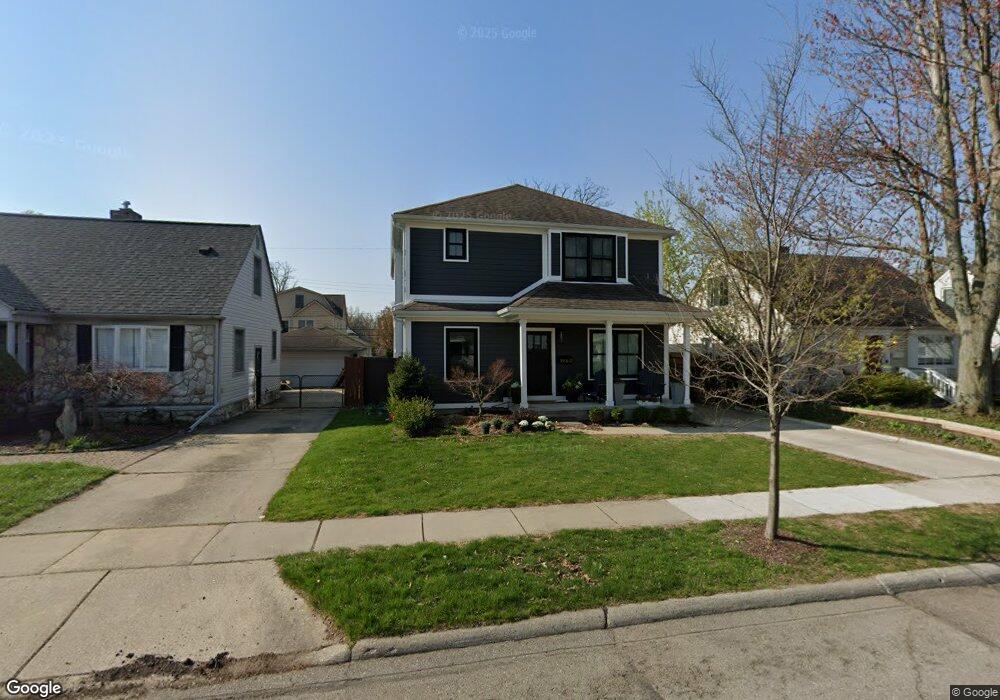
1936 Haynes St Unit Bldg-Unit Birmingham, MI 48009
Estimated Value: $769,892 - $905,000
3
Beds
4
Baths
2,234
Sq Ft
$379/Sq Ft
Est. Value
About This Home
This home is located at 1936 Haynes St Unit Bldg-Unit, Birmingham, MI 48009 and is currently estimated at $846,473, approximately $378 per square foot. 1936 Haynes St Unit Bldg-Unit is a home located in Oakland County with nearby schools including Pembroke Elementary School, Derby Middle School, and Ernest W. Seaholm High School.
Ownership History
Date
Name
Owned For
Owner Type
Purchase Details
Closed on
May 24, 2018
Sold by
Friedlander Joshua and Friedlander Carina
Bought by
Taylor Lauren
Current Estimated Value
Home Financials for this Owner
Home Financials are based on the most recent Mortgage that was taken out on this home.
Original Mortgage
$419,920
Outstanding Balance
$362,395
Interest Rate
4.5%
Mortgage Type
Adjustable Rate Mortgage/ARM
Estimated Equity
$484,078
Purchase Details
Closed on
May 19, 2015
Sold by
Scarpati Michael and Scarpati Brenda
Bought by
Friedlander Joshua and Friedlander Carina
Purchase Details
Closed on
Feb 14, 2012
Sold by
3G Development Iii Llc
Bought by
Scarpati Michael and Scarpati Brenda
Purchase Details
Closed on
Nov 22, 2010
Sold by
Sloan David and Howarth Sloan Leone
Bought by
Roed Spencer
Purchase Details
Closed on
Jun 7, 2002
Sold by
Knowles Walter C
Bought by
Sloan David
Home Financials for this Owner
Home Financials are based on the most recent Mortgage that was taken out on this home.
Original Mortgage
$168,500
Interest Rate
6.34%
Create a Home Valuation Report for This Property
The Home Valuation Report is an in-depth analysis detailing your home's value as well as a comparison with similar homes in the area
Home Values in the Area
Average Home Value in this Area
Purchase History
| Date | Buyer | Sale Price | Title Company |
|---|---|---|---|
| Taylor Lauren | $524,900 | Title Solutions Agency Llc | |
| Friedlander Joshua | $425,000 | Title Solutions | |
| Scarpati Michael | $345,000 | Capital Title Ins Agency | |
| Roed Spencer | $99,000 | Capital Title Ins Agency | |
| 3G Development Iii Llc | -- | Capital Title Ins Agency | |
| Sloan David | $148,250 | -- |
Source: Public Records
Mortgage History
| Date | Status | Borrower | Loan Amount |
|---|---|---|---|
| Open | Taylor Lauren | $419,920 | |
| Previous Owner | Sloan David | $168,500 |
Source: Public Records
Tax History Compared to Growth
Tax History
| Year | Tax Paid | Tax Assessment Tax Assessment Total Assessment is a certain percentage of the fair market value that is determined by local assessors to be the total taxable value of land and additions on the property. | Land | Improvement |
|---|---|---|---|---|
| 2024 | $9,859 | $321,420 | $0 | $0 |
| 2023 | $9,448 | $290,870 | $0 | $0 |
| 2022 | $10,130 | $270,720 | $0 | $0 |
| 2021 | $10,220 | $254,180 | $0 | $0 |
| 2020 | $9,512 | $266,450 | $0 | $0 |
| 2019 | $10,764 | $256,980 | $0 | $0 |
| 2018 | $10,622 | $263,540 | $0 | $0 |
| 2017 | $10,604 | $259,840 | $0 | $0 |
| 2016 | $10,624 | $242,260 | $0 | $0 |
| 2015 | -- | $242,600 | $0 | $0 |
| 2014 | -- | $217,710 | $0 | $0 |
| 2011 | -- | $65,920 | $0 | $0 |
Source: Public Records
Map
Nearby Homes
- 1982 Haynes St
- 1840 Holland St
- 1963 Cole St
- 1971 Bowers St
- 1745 Webster St
- 000 Taunton Rd
- 1760 Cole St
- 425 Lewis Ct Unit 47
- 1777 Hazel St
- 1696 Hazel St
- 1982 E Lincoln St
- 1673 Hazel St
- 2051 Villa Rd Unit 304
- 2051 Villa Rd Unit 302
- 1489 Holland St
- 1773 Villa Rd
- 1633 Villa Rd
- 1524 Villa Rd
- 1324 Holland St
- 3237 Newbury Place
- 1936 Haynes St
- 1948 Haynes St
- 1924 Haynes St
- 1960 Haynes St
- 1951 Holland St
- 1947 Holland St
- 1900 Haynes St
- 1929 Holland St
- 1963 Holland St
- 1996 Haynes St
- 1901 Holland St
- 1890 Haynes St
- 1971 Holland St
- 1947 Haynes St
- 1933 Haynes St
- 1885 Holland St
- 1959 Haynes St
- 1919 Haynes St
- 1878 Haynes St
- 1867 Holland St