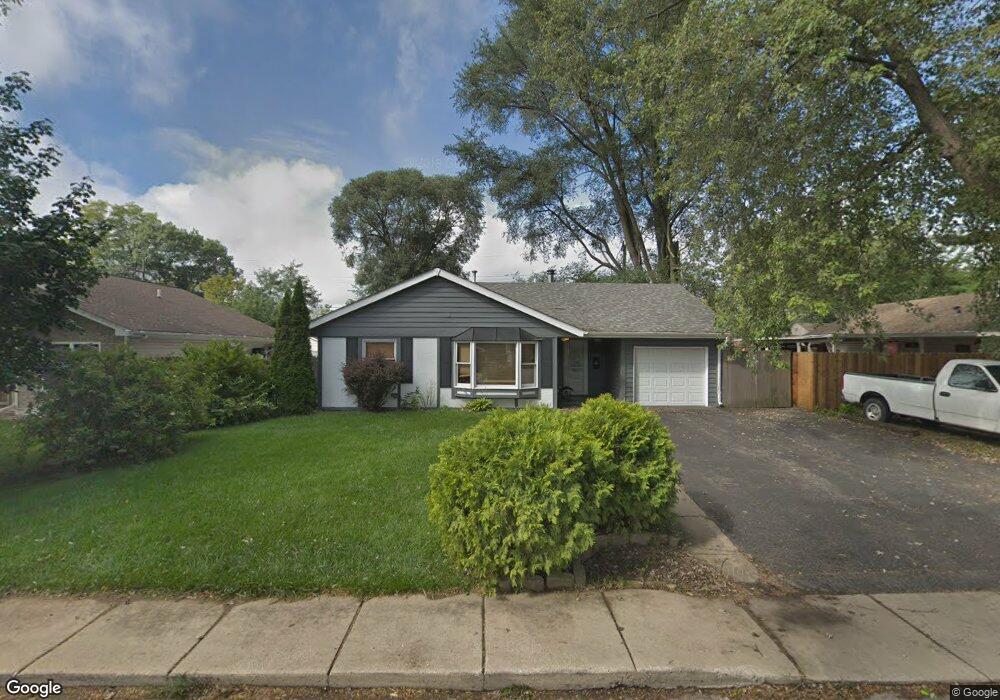
1937 Cherokee Rd Carpentersville, IL 60110
Estimated Value: $241,000 - $258,000
3
Beds
--
Bath
960
Sq Ft
$261/Sq Ft
Est. Value
About This Home
This home is located at 1937 Cherokee Rd, Carpentersville, IL 60110 and is currently estimated at $250,532, approximately $260 per square foot. 1937 Cherokee Rd is a home located in Kane County with nearby schools including Sunny Hill Elementary School, Barrington Middle School Station Campus, and Barrington High School.
Ownership History
Date
Name
Owned For
Owner Type
Purchase Details
Closed on
Oct 15, 1997
Sold by
Kolzow Jacques and Kolzow Hannah B
Bought by
Western Debra L
Current Estimated Value
Home Financials for this Owner
Home Financials are based on the most recent Mortgage that was taken out on this home.
Original Mortgage
$104,959
Outstanding Balance
$17,159
Interest Rate
7.65%
Mortgage Type
FHA
Estimated Equity
$233,373
Purchase Details
Closed on
Oct 1, 1996
Sold by
Colvin Hermond and Colvin Lori
Bought by
Kolzow Jacques and Kolzow Hannah B
Home Financials for this Owner
Home Financials are based on the most recent Mortgage that was taken out on this home.
Original Mortgage
$103,528
Interest Rate
7.94%
Mortgage Type
FHA
Purchase Details
Closed on
May 18, 1993
Sold by
Middlesworth Lori and Colvin Lori
Bought by
Colvin Hermond and Colvin Lori
Home Financials for this Owner
Home Financials are based on the most recent Mortgage that was taken out on this home.
Original Mortgage
$72,900
Interest Rate
9.2%
Create a Home Valuation Report for This Property
The Home Valuation Report is an in-depth analysis detailing your home's value as well as a comparison with similar homes in the area
Home Values in the Area
Average Home Value in this Area
Purchase History
| Date | Buyer | Sale Price | Title Company |
|---|---|---|---|
| Western Debra L | $70,666 | Ticor Title Insurance | |
| Kolzow Jacques | $104,500 | Chicago Title Insurance Co | |
| Colvin Hermond | -- | Lawyers Title Insurance Corp |
Source: Public Records
Mortgage History
| Date | Status | Borrower | Loan Amount |
|---|---|---|---|
| Open | Western Debra L | $104,959 | |
| Previous Owner | Kolzow Jacques | $103,528 | |
| Previous Owner | Colvin Hermond | $72,900 |
Source: Public Records
Tax History Compared to Growth
Tax History
| Year | Tax Paid | Tax Assessment Tax Assessment Total Assessment is a certain percentage of the fair market value that is determined by local assessors to be the total taxable value of land and additions on the property. | Land | Improvement |
|---|---|---|---|---|
| 2024 | $4,683 | $68,600 | $12,553 | $56,047 |
| 2023 | $4,441 | $61,724 | $11,295 | $50,429 |
| 2022 | $4,143 | $54,228 | $11,295 | $42,933 |
| 2021 | $3,970 | $51,202 | $10,665 | $40,537 |
| 2020 | $3,780 | $50,051 | $10,425 | $39,626 |
| 2019 | $3,558 | $47,514 | $9,897 | $37,617 |
| 2018 | $3,133 | $41,011 | $9,701 | $31,310 |
| 2017 | $2,895 | $38,364 | $9,075 | $29,289 |
| 2016 | $2,546 | $33,080 | $8,787 | $24,293 |
| 2015 | -- | $27,441 | $8,234 | $19,207 |
| 2014 | -- | $24,683 | $8,007 | $16,676 |
| 2013 | -- | $25,438 | $8,252 | $17,186 |
Source: Public Records
Map
Nearby Homes
- 140 Hickory Dr
- 1426 Kings Rd
- 105 Siesta Rd
- 103 Hickory Dr
- 200 Amarillo Dr
- 336 Delaware St
- 1811 IL Rte 25 (Elgin) Rd
- 2013 Silverstone Dr Unit 2013
- 308 Amarillo Ct
- 944 Cortney Dr
- 1431 Silverstone Dr Unit 1416
- 2245 Flagstone Ln Unit 155
- 7 Autumn Trail
- 57 Robin Rd
- 1309 Silverstone Dr Unit 1305
- 1303 Silverstone Dr Unit 1302
- 713 Silverstone Dr Unit 77
- 94 Wren Rd
- 171 Lake Shore Dr
- 7 Austin Ave
- 1939 Cherokee Rd
- 1935 Cherokee Rd
- 1105 Chippewa Cir
- 1103 Chippewa Cir
- 1107 Chippewa Cir
- 1933 Cherokee Rd
- 2504 Mocassin Ln
- 1938 Cherokee Rd Unit 5
- 1936 Cherokee Rd
- 1109 Chippewa Cir Unit 5
- 2502 Mocassin Ln Unit 5
- 1940 Cherokee Rd
- 1934 Cherokee Rd
- 1931 Cherokee Rd
- 1111 Chippewa Cir
- 1942 Cherokee Rd
- 1932 Cherokee Rd
- 2505 Mocassin Ln
- 1929 Cherokee Rd
- 1944 Cherokee Rd Unit 5