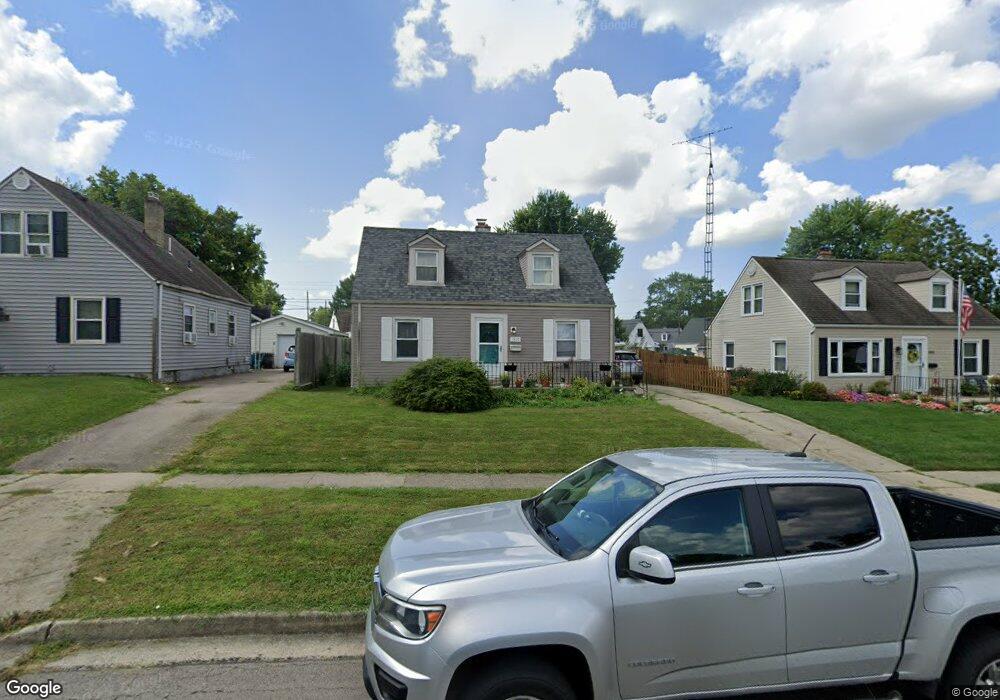
1937 E Bataan Dr Dayton, OH 45420
Estimated Value: $169,875 - $184,000
3
Beds
1
Bath
1,008
Sq Ft
$176/Sq Ft
Est. Value
About This Home
This home is located at 1937 E Bataan Dr, Dayton, OH 45420 and is currently estimated at $176,969, approximately $175 per square foot. 1937 E Bataan Dr is a home located in Montgomery County with nearby schools including Greenmont Elementary School, Kettering Middle School, and Kettering Fairmont High School.
Ownership History
Date
Name
Owned For
Owner Type
Purchase Details
Closed on
Jun 11, 2012
Sold by
Stevens Michael E and Stevens Cynthia G
Bought by
Coherd Christopher L and Speaks Elizabeth L
Current Estimated Value
Purchase Details
Closed on
Jun 3, 2010
Sold by
First Financial Bank Na
Bought by
Stevens Michael E and Stevens Cynthia G
Purchase Details
Closed on
May 26, 2009
Sold by
Cox Brian K and Cox Brian Keith
Bought by
First Financial Bank Na
Purchase Details
Closed on
Sep 10, 2003
Sold by
Tamplin Kelley R and Tamplin Thomas W
Bought by
Cox Brian K
Purchase Details
Closed on
Mar 20, 2003
Sold by
Cox Brian K
Bought by
Tamplin Kelley R
Purchase Details
Closed on
Sep 24, 1999
Sold by
Roepken Junaita C
Bought by
Cox Brian K
Home Financials for this Owner
Home Financials are based on the most recent Mortgage that was taken out on this home.
Original Mortgage
$53,200
Interest Rate
6.87%
Create a Home Valuation Report for This Property
The Home Valuation Report is an in-depth analysis detailing your home's value as well as a comparison with similar homes in the area
Home Values in the Area
Average Home Value in this Area
Purchase History
| Date | Buyer | Sale Price | Title Company |
|---|---|---|---|
| Coherd Christopher L | $82,000 | Fidelity Lawyers Title Agenc | |
| Stevens Michael E | $55,000 | Attorney | |
| First Financial Bank Na | $52,000 | None Available | |
| Cox Brian K | -- | -- | |
| Tamplin Kelley R | -- | -- | |
| Cox Brian K | $56,000 | Landmark Title Agency Inc |
Source: Public Records
Mortgage History
| Date | Status | Borrower | Loan Amount |
|---|---|---|---|
| Previous Owner | Cox Brian K | $53,200 |
Source: Public Records
Tax History
| Year | Tax Paid | Tax Assessment Tax Assessment Total Assessment is a certain percentage of the fair market value that is determined by local assessors to be the total taxable value of land and additions on the property. | Land | Improvement |
|---|---|---|---|---|
| 2025 | $3,013 | $46,680 | $11,010 | $35,670 |
| 2024 | $2,928 | $46,680 | $11,010 | $35,670 |
| 2023 | $2,928 | $46,680 | $11,010 | $35,670 |
| 2022 | $2,591 | $32,590 | $7,700 | $24,890 |
| 2021 | $2,399 | $32,590 | $7,700 | $24,890 |
| 2020 | $2,406 | $32,590 | $7,700 | $24,890 |
| 2019 | $2,472 | $29,630 | $7,700 | $21,930 |
| 2018 | $2,485 | $29,630 | $7,700 | $21,930 |
| 2017 | $2,292 | $29,630 | $7,700 | $21,930 |
| 2016 | $2,146 | $26,030 | $7,700 | $18,330 |
| 2015 | $2,051 | $26,030 | $7,700 | $18,330 |
| 2014 | $2,051 | $26,030 | $7,700 | $18,330 |
| 2012 | -- | $30,640 | $8,400 | $22,240 |
Source: Public Records
Map
Nearby Homes
- 2291 Patterson Rd
- 1534 Horlacher Ave
- 1513 Horlacher Ave
- 1421 Flesher Ave
- 2112 Patterson Rd
- 2817 Kennedy Ave
- 1529 Watervliet Ave
- 2040 Courtland Ave
- 2216 Culver Ave
- 1618 Briedweng Ave Unit 1616
- 5123 Haverfield Rd
- 2929 Wayland Ave
- 2908 Hazel Ave
- 2904 Kingston Ave
- 4883 Rainier Dr
- 2408 Homeland Ct
- 1409 Highview Ave
- 1104 Chelsea Ave
- 4517 Debra Ave
- 1020 Weng Ave
- 1941 E Bataan Dr
- 1933 E Bataan Dr
- 1945 E Bataan Dr
- 1920 Malcom Dr
- 1914 Malcom Dr
- 1925 E Bataan Dr
- 1938 Craig Dr
- 1942 Craig Dr
- 1932 E Bataan Dr
- 1946 Craig Dr
- 1932 Malcom Dr
- 1936 E Bataan Dr
- 1953 E Bataan Dr
- 1926 E Bataan Dr
- 1950 Craig Dr
- 1940 E Bataan Dr
- 1957 E Bataan Dr
- 1944 E Bataan Dr
- 1920 E Bataan Dr
- 1954 Craig Dr
Your Personal Tour Guide
Ask me questions while you tour the home.