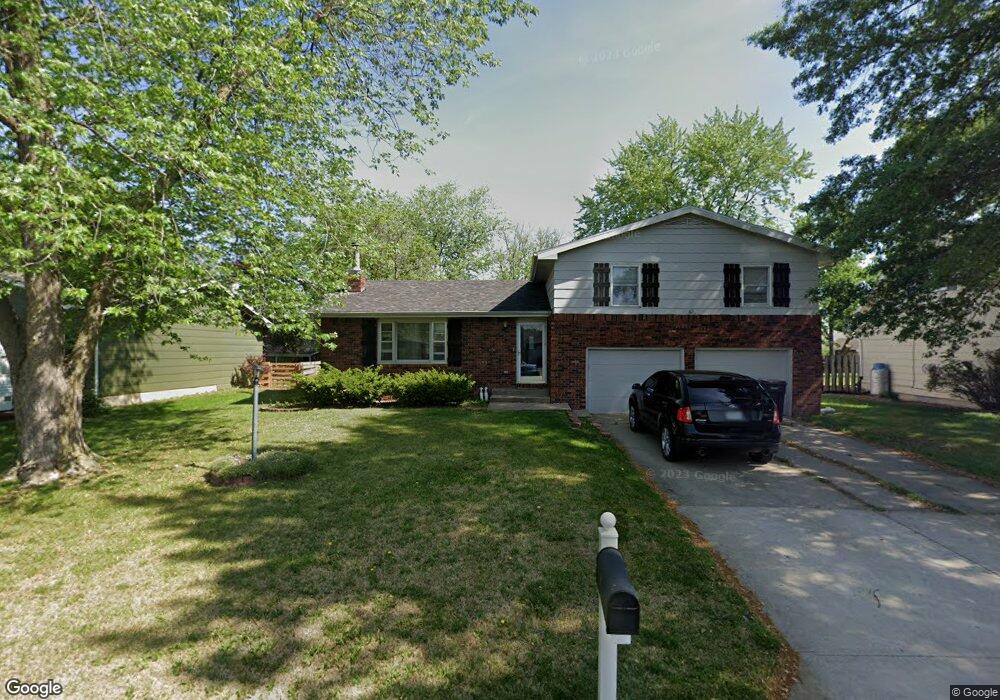
1937 Eastbrook Cir Moberly, MO 65270
Estimated Value: $228,000 - $234,000
3
Beds
3
Baths
1,875
Sq Ft
$123/Sq Ft
Est. Value
About This Home
This home is located at 1937 Eastbrook Cir, Moberly, MO 65270 and is currently estimated at $230,001, approximately $122 per square foot. 1937 Eastbrook Cir is a home located in Randolph County with nearby schools including Moberly Senior High School and Maranatha Seventh-day Adventist School.
Ownership History
Date
Name
Owned For
Owner Type
Purchase Details
Closed on
Sep 21, 2020
Sold by
C-Kirkendoll Christina C and Kirkendoll Jesse D
Bought by
Shoemaker Brian
Current Estimated Value
Home Financials for this Owner
Home Financials are based on the most recent Mortgage that was taken out on this home.
Original Mortgage
$140,000
Outstanding Balance
$124,241
Interest Rate
2.9%
Estimated Equity
$105,760
Purchase Details
Closed on
Mar 6, 2015
Sold by
Brawner Megan E and Brawner Patrick R
Bought by
Couch Christina C and Kirkendoll Jesse D
Home Financials for this Owner
Home Financials are based on the most recent Mortgage that was taken out on this home.
Original Mortgage
$129,200
Interest Rate
3.6%
Mortgage Type
Stand Alone First
Purchase Details
Closed on
Jan 26, 2007
Sold by
Grover Alex R and Grover Sarah K
Bought by
Williams Brenda K
Home Financials for this Owner
Home Financials are based on the most recent Mortgage that was taken out on this home.
Original Mortgage
$108,000
Interest Rate
6.19%
Create a Home Valuation Report for This Property
The Home Valuation Report is an in-depth analysis detailing your home's value as well as a comparison with similar homes in the area
Home Values in the Area
Average Home Value in this Area
Purchase History
| Date | Buyer | Sale Price | Title Company |
|---|---|---|---|
| Shoemaker Brian | -- | None Available | |
| Couch Christina C | -- | None Available | |
| Williams Brenda K | -- | -- |
Source: Public Records
Mortgage History
| Date | Status | Borrower | Loan Amount |
|---|---|---|---|
| Open | Shoemaker Brian | $140,000 | |
| Previous Owner | Couch Christina C | $129,200 | |
| Previous Owner | Williams Brenda K | $108,000 |
Source: Public Records
Tax History Compared to Growth
Tax History
| Year | Tax Paid | Tax Assessment Tax Assessment Total Assessment is a certain percentage of the fair market value that is determined by local assessors to be the total taxable value of land and additions on the property. | Land | Improvement |
|---|---|---|---|---|
| 2025 | $1,837 | $27,090 | $3,269 | $23,821 |
| 2024 | $1,837 | $25,220 | $2,850 | $22,370 |
| 2023 | $1,865 | $25,220 | $2,850 | $22,370 |
| 2022 | $1,815 | $25,210 | $2,850 | $22,360 |
| 2021 | $1,814 | $25,210 | $2,850 | $22,360 |
| 2020 | $1,814 | $25,210 | $2,850 | $22,360 |
| 2019 | $1,810 | $25,210 | $2,850 | $22,360 |
| 2018 | $1,876 | $26,210 | $2,850 | $23,360 |
| 2017 | $1,873 | $26,210 | $0 | $0 |
| 2016 | $1,789 | $25,180 | $0 | $0 |
| 2014 | -- | $22,750 | $0 | $0 |
| 2013 | -- | $22,750 | $0 | $0 |
| 2012 | -- | $22,840 | $0 | $0 |
Source: Public Records
Map
Nearby Homes
- 1410 Hulen Dr
- 606 Weintz St
- 718 E Logan St
- 428 Woodland Ave
- 509 Cleveland Ave
- 818 Vincil St
- 319 Halleck St
- 524 Barrow St
- 531 Farror St
- 208 Wisdom St
- 602 Vincil St
- 614 Union Ave
- 101 N Ault St
- 511 Union Ave
- 2003 County Road 1740
- 517 S Clark St
- 720 Saint Charles St
- 1000 S Williams St
- 619 Madison Ave
- 1216 Shepherds Dr
- 1931 Eastbrook Cir
- 1943 Eastbrook Cir
- 1942 Eastbrook Cir
- 1948 Eastbrook Cir
- 1925 Eastbrook Cir
- 1614 Prairie Ln
- 1620 Prairie Ln
- 1949 Eastbrook Cir
- 1626 Prairie Ln
- 610 Meadowbrook Cir
- 1930 Eastbrook Cir
- 1919 Eastbrook Cir
- 600 Meadowbrook Cir
- 1632 Prairie Ln
- 1924 Eastbrook Cir
- 1913 Eastbrook Cir
- 616 Meadowbrook Cir
- 613 Meadowbrook Cir
- 1638 Prairie Ln
- 1613 Prairie Ln