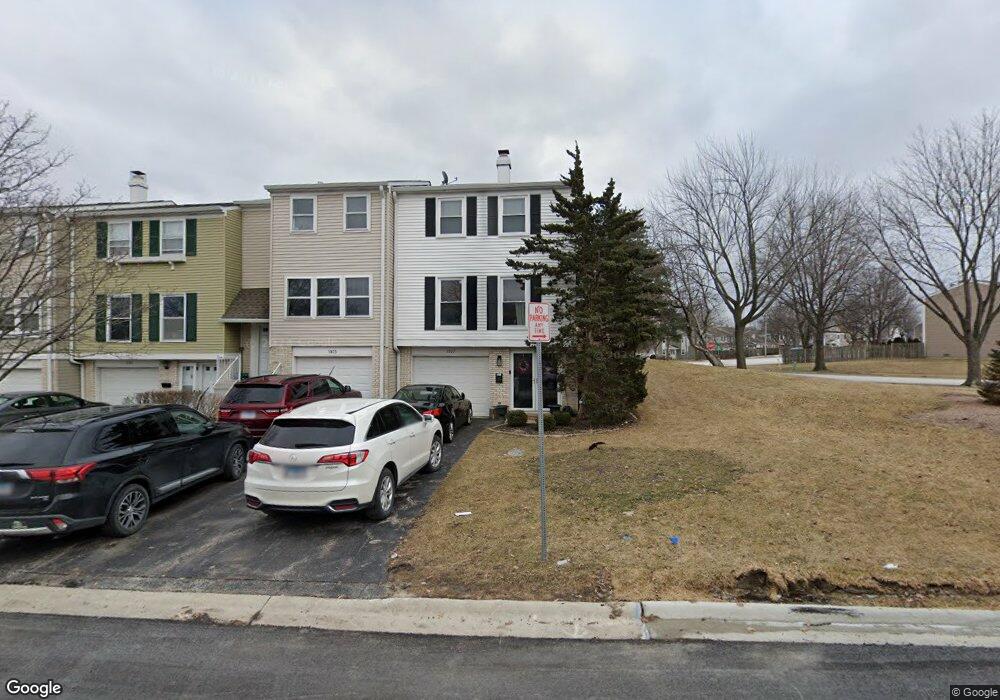
1937 Farnham Ct Unit 4 Schaumburg, IL 60194
West Schaumburg NeighborhoodEstimated Value: $289,000 - $301,000
3
Beds
2
Baths
1,300
Sq Ft
$227/Sq Ft
Est. Value
About This Home
This home is located at 1937 Farnham Ct Unit 4, Schaumburg, IL 60194 and is currently estimated at $294,999, approximately $226 per square foot. 1937 Farnham Ct Unit 4 is a home located in Cook County with nearby schools including Neil Armstrong Elementary School, Dwight D Eisenhower Junior High School, and Hoffman Estates High School.
Ownership History
Date
Name
Owned For
Owner Type
Purchase Details
Closed on
Dec 23, 2019
Sold by
Sajiad Ashfaq and Sajiad Kazim
Bought by
Keller Ifrose
Current Estimated Value
Home Financials for this Owner
Home Financials are based on the most recent Mortgage that was taken out on this home.
Original Mortgage
$142,836
Outstanding Balance
$125,682
Interest Rate
3.5%
Mortgage Type
FHA
Estimated Equity
$169,317
Purchase Details
Closed on
Sep 30, 2002
Sold by
Johnson Don and Johnson Donald W
Bought by
Sajjad Ashfaq and Sajjad Ifrose
Home Financials for this Owner
Home Financials are based on the most recent Mortgage that was taken out on this home.
Original Mortgage
$140,400
Interest Rate
7.95%
Purchase Details
Closed on
Jun 25, 2001
Sold by
Scaletta Anthony J
Bought by
Johnson Don
Home Financials for this Owner
Home Financials are based on the most recent Mortgage that was taken out on this home.
Original Mortgage
$136,010
Interest Rate
7.18%
Mortgage Type
FHA
Create a Home Valuation Report for This Property
The Home Valuation Report is an in-depth analysis detailing your home's value as well as a comparison with similar homes in the area
Home Values in the Area
Average Home Value in this Area
Purchase History
| Date | Buyer | Sale Price | Title Company |
|---|---|---|---|
| Keller Ifrose | -- | Ravenswood Title Company Llc | |
| Sajjad Ashfaq | $156,000 | -- | |
| Johnson Don | $138,000 | -- |
Source: Public Records
Mortgage History
| Date | Status | Borrower | Loan Amount |
|---|---|---|---|
| Open | Keller Ifrose | $142,836 | |
| Closed | Sajjad Ashfaq | $140,400 | |
| Previous Owner | Johnson Don | $136,010 |
Source: Public Records
Tax History Compared to Growth
Tax History
| Year | Tax Paid | Tax Assessment Tax Assessment Total Assessment is a certain percentage of the fair market value that is determined by local assessors to be the total taxable value of land and additions on the property. | Land | Improvement |
|---|---|---|---|---|
| 2024 | $4,407 | $19,100 | $3,501 | $15,599 |
| 2023 | $4,237 | $19,100 | $3,501 | $15,599 |
| 2022 | $4,237 | $19,100 | $3,501 | $15,599 |
| 2021 | $3,415 | $14,625 | $5,236 | $9,389 |
| 2020 | $3,429 | $14,625 | $5,236 | $9,389 |
| 2019 | $3,430 | $16,250 | $5,236 | $11,014 |
| 2018 | $3,917 | $16,505 | $4,571 | $11,934 |
| 2017 | $3,873 | $16,505 | $4,571 | $11,934 |
| 2016 | $3,861 | $16,505 | $4,571 | $11,934 |
| 2015 | $3,194 | $13,325 | $3,990 | $9,335 |
| 2014 | $3,174 | $13,325 | $3,990 | $9,335 |
| 2013 | $3,075 | $13,325 | $3,990 | $9,335 |
Source: Public Records
Map
Nearby Homes
- 923 Banbury Ct Unit 4
- 1912 Finchley Ct Unit 3
- 1929 Hastings Ct Unit 3
- 2216 Andover Ct
- 752 N Brookdale Dr
- 845 Harmon Blvd
- 775 Harmon Blvd
- 730 Hamilton Cir
- 2342 Hamilton Place
- 1975 Leiter Way Unit 12002
- 1988 Leiter Way Unit 13001
- 1981 Leiter Way Unit 12005
- 1977 Leiter Way Unit 12003
- 1986 Leiter Way Unit 13002
- 1711 Pebble Beach Ct
- 323 Green Knoll Ln Unit 1818
- 1375 Rebecca Dr Unit 213
- 1941 Quaker Hollow Ln Unit 11
- 1968 Quaker Hollow Ln Unit 12
- 196 Green Ct Unit 1
- 1935 Farnham Ct
- 1931 Farnham Ct Unit 4
- 1929 Farnham Ct
- 1927 Farnham Ct Unit 4
- 2001 Farnham Ct Unit 4
- 2003 Farnham Ct Unit 4
- 2001 Briar Hill Dr
- 2005 Farnham Ct Unit 4
- 2007 Farnham Ct Unit 4
- 1926 Farnham Ct Unit 4
- 1928 Farnham Ct Unit 4
- 2009 Farnham Ct
- 1930 Farnham Ct Unit 4
- 1930 Farnham Ct Unit 1930
- 2000 Briar Hill Dr
- 1932 Farnham Ct Unit 4
- 1924 Farnham Ct Unit 4
- 1934 Farnham Ct Unit 4
- 2011 Farnham Ct
- 1936 Farnham Ct Unit 4