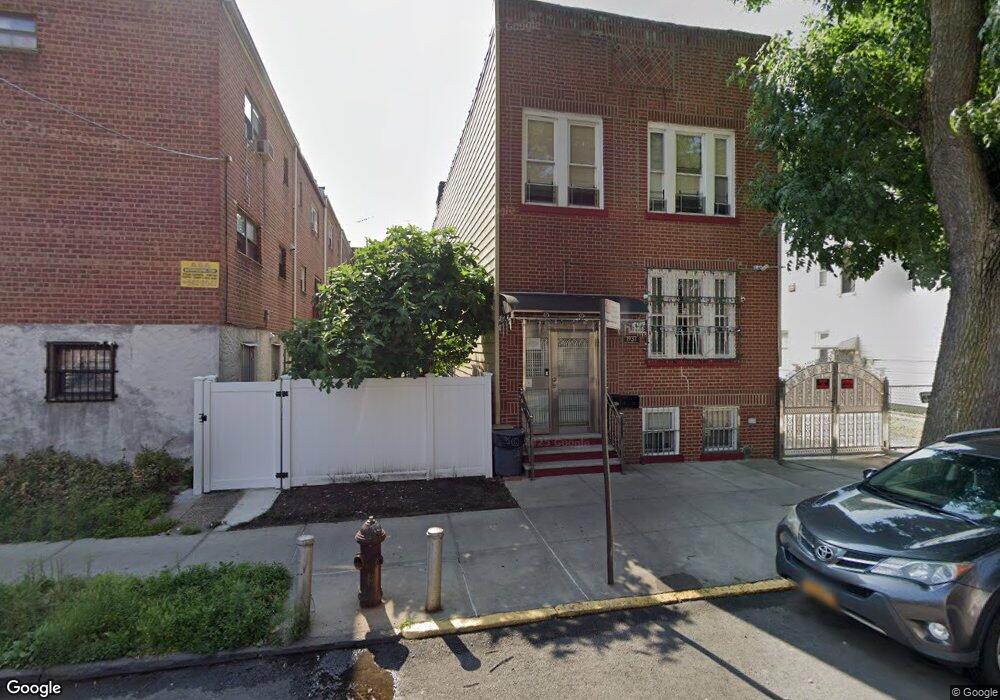
1937 Hunt Ave Unit 2F Bronx, NY 10462
Van Nest NeighborhoodEstimated Value: $840,000 - $1,086,000
2
Beds
1
Bath
4,080
Sq Ft
$233/Sq Ft
Est. Value
About This Home
This home is located at 1937 Hunt Ave Unit 2F, Bronx, NY 10462 and is currently estimated at $949,667, approximately $232 per square foot. 1937 Hunt Ave Unit 2F is a home located in Bronx County with nearby schools including P.S. 105 Senator Abraham Bernstein, Pelham Academy, and Bronx Green Middle School.
Ownership History
Date
Name
Owned For
Owner Type
Purchase Details
Closed on
Jun 5, 2014
Sold by
Bisnath Rajendranauth and Bisnath Taramatie
Bought by
Rajendranauth Bisnath Irrevocable Reside and Justin Bisnath As Co-Trustee
Current Estimated Value
Purchase Details
Closed on
May 18, 2005
Sold by
Bisnauth Rajendranauth
Bought by
Bisnauth Rajendranauth and Bisnauth Taramatie
Purchase Details
Closed on
Jun 4, 1997
Sold by
Bisnauth Taramatie and Bisnauth Rajendranauth
Bought by
Bisnauth Rajendranauth
Purchase Details
Closed on
Jan 30, 1997
Sold by
Raghubir Deochand and Bisnath Rajendranauth
Bought by
Bisnath Rajendranauth and Bisnath Taramatie
Purchase Details
Closed on
May 15, 1995
Sold by
Oyola Freida and Tolozano Freida
Bought by
Bisnath Rajendranauth and Raghubir Deochand
Create a Home Valuation Report for This Property
The Home Valuation Report is an in-depth analysis detailing your home's value as well as a comparison with similar homes in the area
Home Values in the Area
Average Home Value in this Area
Purchase History
| Date | Buyer | Sale Price | Title Company |
|---|---|---|---|
| Rajendranauth Bisnath Irrevocable Reside | -- | -- | |
| Rajendranauth Bisnath Irrevocable Reside | -- | -- | |
| Bisnath Rajendranauth | -- | -- | |
| Bisnauth Rajendranauth | -- | -- | |
| Bisnauth Rajendranauth | -- | -- | |
| Bisnauth Rajendranauth | -- | First American Title Ins Co | |
| Bisnauth Rajendranauth | -- | First American Title Ins Co | |
| Bisnath Rajendranauth | -- | -- | |
| Bisnath Rajendranauth | -- | -- | |
| Bisnath Rajendranauth | $200,000 | -- | |
| Bisnath Rajendranauth | $200,000 | -- |
Source: Public Records
Tax History Compared to Growth
Tax History
| Year | Tax Paid | Tax Assessment Tax Assessment Total Assessment is a certain percentage of the fair market value that is determined by local assessors to be the total taxable value of land and additions on the property. | Land | Improvement |
|---|---|---|---|---|
| 2025 | $7,903 | $41,057 | $6,108 | $34,949 |
| 2024 | $7,903 | $40,747 | $6,392 | $34,355 |
| 2023 | $7,523 | $38,442 | $6,414 | $32,028 |
| 2022 | $6,953 | $49,080 | $8,640 | $40,440 |
| 2021 | $6,897 | $51,540 | $8,640 | $42,900 |
| 2020 | $6,912 | $48,480 | $8,640 | $39,840 |
| 2019 | $6,810 | $40,200 | $8,640 | $31,560 |
| 2018 | $6,233 | $32,035 | $6,030 | $26,005 |
| 2017 | $5,861 | $30,222 | $8,044 | $22,178 |
| 2016 | $5,390 | $28,512 | $7,345 | $21,167 |
| 2015 | $3,219 | $28,512 | $7,466 | $21,046 |
| 2014 | $3,219 | $28,297 | $8,895 | $19,402 |
Source: Public Records
Map
Nearby Homes
- 1914 Holland Ave
- 1961 Wallace Ave
- 661 Sagamore St
- 1865 Hunt Ave
- 681 Rhinelander Ave
- 1907 Barnes Ave
- 1858 Wallace Ave
- 1916 Barnes Ave
- 762 Brady Ave Unit 221
- 762 Brady Ave Unit 621
- 754 Brady Ave Unit 303
- 1827 Amethyst St
- 756 Brady Ave Unit 507
- 758 Brady Ave Unit 411
- 758 Brady Ave Unit 214
- 760 Brady Ave Unit 417
- 760 Brady Ave Unit 117
- 1869 Muliner Ave
- 1904 Bronxdale Ave
- 2081 Cruger Ave Unit 6L
- 1937 Hunt Ave
- 1937 Hunt Ave Unit 2R
- 713 Sagamore St
- 715 Sagamore St
- 1941 Hunt Ave
- 711 Sagamore St
- 717 Sagamore St
- 1945 Hunt Ave
- 709 Sagamore St
- 1946 Cruger Ave
- 1948 Cruger Ave
- 1947 Hunt Ave
- 1950 Cruger Ave
- 1936 Hunt Ave
- 701 Sagamore St
- 1949 Hunt Ave
- 1970 Cruger Ave
- 712 Sagamore St
- 710 Sagamore St
- 714 Sagamore St