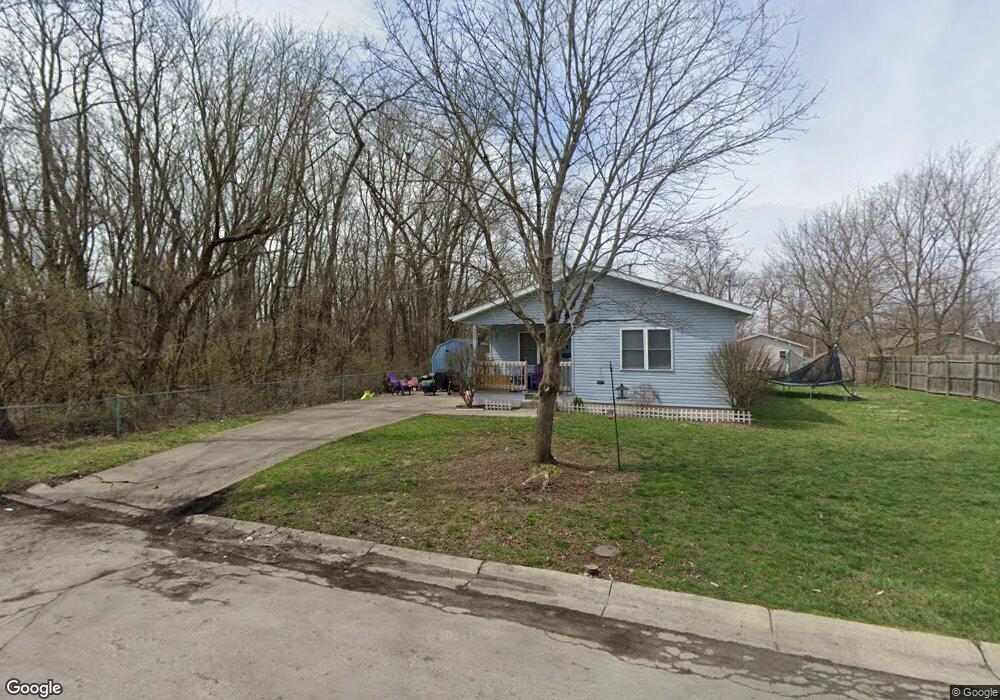
1937 Ohio Ave Springfield, OH 45505
Estimated Value: $87,000 - $105,000
4
Beds
1
Bath
1,216
Sq Ft
$78/Sq Ft
Est. Value
About This Home
This home is located at 1937 Ohio Ave, Springfield, OH 45505 and is currently estimated at $94,496, approximately $77 per square foot. 1937 Ohio Ave is a home located in Clark County with nearby schools including Lincoln Elementary School, Hayward Middle School, and Springfield High School.
Ownership History
Date
Name
Owned For
Owner Type
Purchase Details
Closed on
Dec 6, 2017
Sold by
Neighborhood Housing Partnership Of Grea
Bought by
Williams Natalie N
Current Estimated Value
Home Financials for this Owner
Home Financials are based on the most recent Mortgage that was taken out on this home.
Original Mortgage
$49,000
Outstanding Balance
$27,279
Interest Rate
3.94%
Mortgage Type
Stand Alone Second
Estimated Equity
$67,217
Purchase Details
Closed on
Jun 30, 2017
Sold by
Clark County Fuller Center For Housing
Bought by
Neighborhood Housing Partnership Of Grea
Home Financials for this Owner
Home Financials are based on the most recent Mortgage that was taken out on this home.
Original Mortgage
$107,551
Interest Rate
3.94%
Mortgage Type
Future Advance Clause Open End Mortgage
Purchase Details
Closed on
Aug 16, 2016
Sold by
Capital One Bank
Bought by
Clark County Community Habitat For Human and Clark County Fuller Center For Housing O
Create a Home Valuation Report for This Property
The Home Valuation Report is an in-depth analysis detailing your home's value as well as a comparison with similar homes in the area
Home Values in the Area
Average Home Value in this Area
Purchase History
| Date | Buyer | Sale Price | Title Company |
|---|---|---|---|
| Williams Natalie N | $50,000 | Ohio Real Estate Title Hold | |
| Neighborhood Housing Partnership Of Grea | $28,000 | Ohio Real Estate Title Hold | |
| Clark County Community Habitat For Human | $16,667 | None Available |
Source: Public Records
Mortgage History
| Date | Status | Borrower | Loan Amount |
|---|---|---|---|
| Open | Williams Natalie N | $49,000 | |
| Previous Owner | Neighborhood Housing Partnership Of Grea | $107,551 |
Source: Public Records
Tax History Compared to Growth
Tax History
| Year | Tax Paid | Tax Assessment Tax Assessment Total Assessment is a certain percentage of the fair market value that is determined by local assessors to be the total taxable value of land and additions on the property. | Land | Improvement |
|---|---|---|---|---|
| 2024 | $897 | $18,620 | $1,550 | $17,070 |
| 2023 | $897 | $18,620 | $1,550 | $17,070 |
| 2022 | $919 | $18,620 | $1,550 | $17,070 |
| 2021 | $851 | $15,910 | $1,320 | $14,590 |
| 2020 | $853 | $15,910 | $1,320 | $14,590 |
| 2019 | $855 | $15,910 | $1,320 | $14,590 |
| 2018 | $808 | $14,450 | $1,320 | $13,130 |
| 2017 | $831 | $14,452 | $1,323 | $13,129 |
| 2016 | $2,367 | $14,452 | $1,323 | $13,129 |
| 2015 | $7,018 | $14,452 | $1,323 | $13,129 |
| 2014 | $844 | $14,452 | $1,323 | $13,129 |
| 2013 | $2,920 | $14,452 | $1,323 | $13,129 |
Source: Public Records
Map
Nearby Homes
- 1820 Clay St
- 551 Georgia Ave
- 1519 Tibbetts Ave
- 1435 Logan Ave
- 1754 S Fountain Ave
- 550 E Rose St
- 711 Kinnane Ave
- 127 Rice St
- 208 Corlington Dr
- 1414 Woodward Ave
- 0 W Perrin Ave Unit 945728
- 0 W Perrin Ave Unit 1041970
- 1355 S Fountain Ave
- 201 Kinnane Ave
- 1159 Selma Rd
- 1047 Cypress St
- 1630 S Sweetbriar Ln
- 1361 Woodward Ave
- 1815 Beacon St
- 1111 Lafayette Ave
- 1927 Ohio Ave
- 1936 Michigan Ave
- 1932 Michigan Ave
- 1928 Michigan Ave
- 1823 Ohio Ave
- 1924 Michigan Ave
- 1932 Ohio Ave
- 1930 Ohio Ave
- 1915 Ohio Ave
- 1119 Ohio Ave
- 1920 Michigan Ave
- 1924 Ohio Ave
- 1917 Ohio Ave
- 1914 Ohio Ave
- 1935 Michigan Ave
- 1929 Michigan Ave
- 1906 Michigan Ave
- 1918 Ohio Ave
- 1915 Michigan Ave
- 1910 Ohio Ave