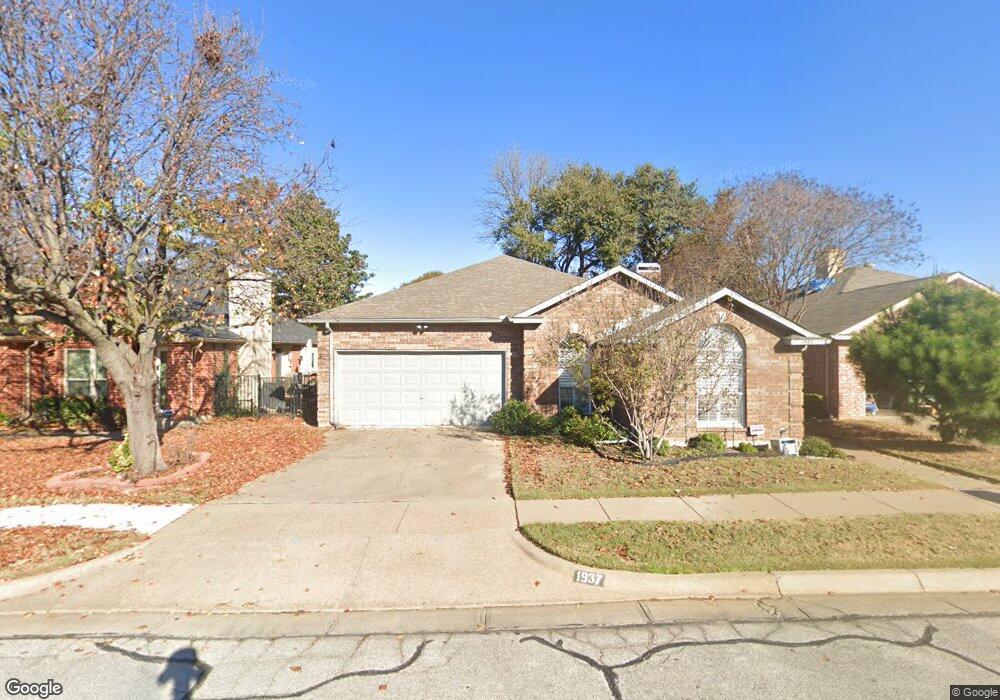
1937 Pine Ridge Dr Bedford, TX 76021
Estimated Value: $323,000 - $354,000
3
Beds
2
Baths
1,639
Sq Ft
$207/Sq Ft
Est. Value
About This Home
This home is located at 1937 Pine Ridge Dr, Bedford, TX 76021 and is currently estimated at $338,705, approximately $206 per square foot. 1937 Pine Ridge Dr is a home located in Tarrant County with nearby schools including Shady Brook Elementary School, Harwood Junior High School, and Trinity High School.
Ownership History
Date
Name
Owned For
Owner Type
Purchase Details
Closed on
Oct 8, 2001
Sold by
Cook Elois H and Cook James David
Bought by
Rhodes Patricia
Current Estimated Value
Home Financials for this Owner
Home Financials are based on the most recent Mortgage that was taken out on this home.
Original Mortgage
$106,800
Outstanding Balance
$41,653
Interest Rate
6.84%
Estimated Equity
$297,052
Purchase Details
Closed on
Nov 7, 1997
Sold by
Cook Eloise H
Bought by
Cook James David and Seals Janet Elaine
Purchase Details
Closed on
Jul 28, 1997
Sold by
Church Penelope Ann
Bought by
Cook Eloise H
Home Financials for this Owner
Home Financials are based on the most recent Mortgage that was taken out on this home.
Original Mortgage
$102,000
Interest Rate
7.6%
Create a Home Valuation Report for This Property
The Home Valuation Report is an in-depth analysis detailing your home's value as well as a comparison with similar homes in the area
Home Values in the Area
Average Home Value in this Area
Purchase History
| Date | Buyer | Sale Price | Title Company |
|---|---|---|---|
| Rhodes Patricia | -- | Alamo Title Company | |
| Cook James David | -- | -- | |
| Cook Eloise H | -- | American Title Co |
Source: Public Records
Mortgage History
| Date | Status | Borrower | Loan Amount |
|---|---|---|---|
| Open | Rhodes Patricia | $106,800 | |
| Previous Owner | Cook Eloise H | $102,000 |
Source: Public Records
Tax History Compared to Growth
Tax History
| Year | Tax Paid | Tax Assessment Tax Assessment Total Assessment is a certain percentage of the fair market value that is determined by local assessors to be the total taxable value of land and additions on the property. | Land | Improvement |
|---|---|---|---|---|
| 2025 | $1,116 | $286,938 | $60,000 | $226,938 |
| 2024 | $1,116 | $344,349 | $60,000 | $284,349 |
| 2023 | $5,411 | $299,466 | $40,000 | $259,466 |
| 2022 | $5,601 | $282,293 | $40,000 | $242,293 |
| 2021 | $5,492 | $266,307 | $40,000 | $226,307 |
| 2020 | $5,039 | $240,261 | $40,000 | $200,261 |
| 2019 | $4,681 | $241,826 | $40,000 | $201,826 |
| 2018 | $2,247 | $175,160 | $40,000 | $135,160 |
| 2017 | $3,852 | $193,246 | $18,000 | $175,246 |
| 2016 | $3,502 | $171,779 | $18,000 | $153,779 |
| 2015 | $2,249 | $131,600 | $18,000 | $113,600 |
| 2014 | $2,249 | $131,600 | $18,000 | $113,600 |
Source: Public Records
Map
Nearby Homes
- 2024 Oakmeadow St
- 2112 Oakmeadow Place
- 2109 Oakmeadow St
- 22 Lincolnshire Cir
- 1601 Warwickshire Ct W
- 2524 Shady Ridge Dr
- 2503 Shady Ridge Dr
- 1723 Post Oak Dr
- 1630 Post Oak Dr
- 37 Devonshire Dr
- 2417 Meadow Ct
- 31 Morrow Dr
- 49 Morrow Dr
- 2220 Tiffany Glenn Ct
- 2901 Miles Way
- 6 Park Ln
- 18 Park Ln
- 2909 Oakridge Dr
- 1704 Indian Oaks Ct
- 1636 Bedford Oaks Dr
- 1933 Pine Ridge Dr
- 1941 Pine Ridge Dr
- 1945 Pine Ridge Dr
- 2509 Sunshine Ct
- 2505 Sunshine Ct
- 1936 Pine Ridge Dr
- 1932 Pine Ridge Dr
- 2513 Sunshine Ct
- 1949 Pine Ridge Dr
- 1925 Pine Ridge Dr
- 1928 Pine Ridge Dr
- 2501 Sunshine Ct
- 1944 Pine Ridge Dr
- 1924 Pine Ridge Dr
- 1921 Pine Ridge Dr
- 1948 Pine Ridge Dr
- 1937 Realistic Dr
- 1933 Realistic Dr
- 2517 Sunshine Ct
- 1941 Realistic Dr