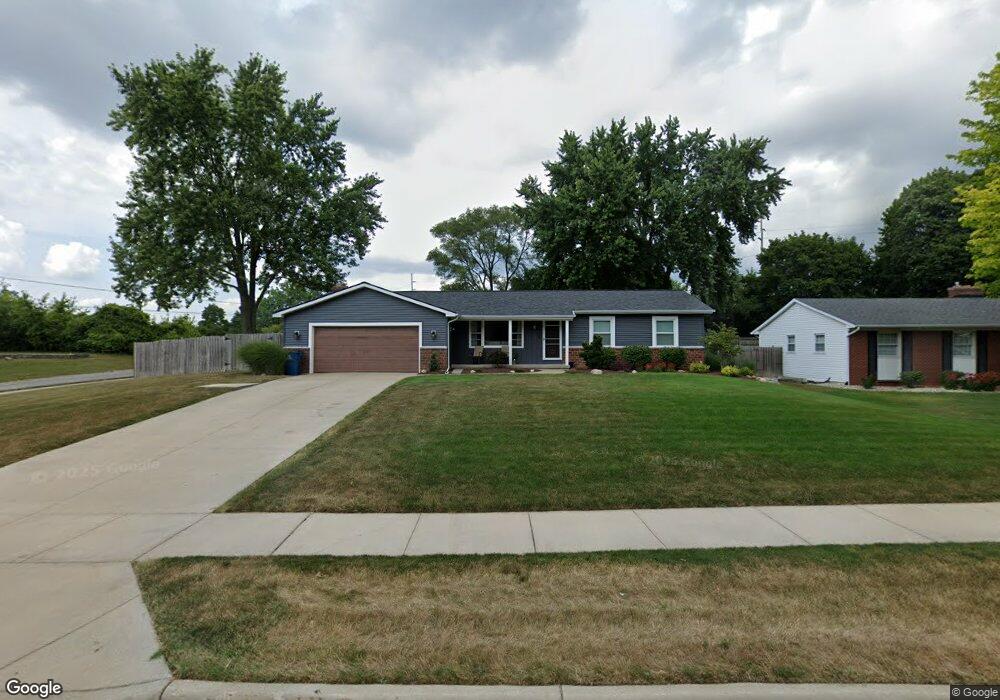
1937 Rondo St SE Grand Rapids, MI 49508
Estimated Value: $340,000 - $352,000
3
Beds
2
Baths
1,328
Sq Ft
$260/Sq Ft
Est. Value
About This Home
This home is located at 1937 Rondo St SE, Grand Rapids, MI 49508 and is currently estimated at $344,986, approximately $259 per square foot. 1937 Rondo St SE is a home located in Kent County with nearby schools including John W. Luff Elementary School, Bowen Elementary, and Crestwood Middle School.
Ownership History
Date
Name
Owned For
Owner Type
Purchase Details
Closed on
Feb 19, 2020
Sold by
Mancuso Michael D
Bought by
Mancuso Michael D and Mancuso Allison B
Current Estimated Value
Home Financials for this Owner
Home Financials are based on the most recent Mortgage that was taken out on this home.
Original Mortgage
$153,600
Outstanding Balance
$136,002
Interest Rate
3.6%
Mortgage Type
New Conventional
Estimated Equity
$208,984
Purchase Details
Closed on
May 16, 2014
Sold by
Kamphouse John J and Revoc Freda Kamphouse
Bought by
Mancuso Michael D
Home Financials for this Owner
Home Financials are based on the most recent Mortgage that was taken out on this home.
Original Mortgage
$109,283
Interest Rate
4.75%
Mortgage Type
FHA
Purchase Details
Closed on
Feb 11, 2008
Sold by
Kamphouse John J and Kamphouse Freda
Bought by
Livin John J and Livin Freda Kamphouse Revocable
Create a Home Valuation Report for This Property
The Home Valuation Report is an in-depth analysis detailing your home's value as well as a comparison with similar homes in the area
Home Values in the Area
Average Home Value in this Area
Purchase History
| Date | Buyer | Sale Price | Title Company |
|---|---|---|---|
| Mancuso Michael D | -- | None Available | |
| Mancuso Michael D | $111,300 | None Available | |
| Livin John J | -- | None Available |
Source: Public Records
Mortgage History
| Date | Status | Borrower | Loan Amount |
|---|---|---|---|
| Open | Mancuso Michael D | $153,600 | |
| Closed | Mancuso Michael D | $109,283 |
Source: Public Records
Tax History Compared to Growth
Tax History
| Year | Tax Paid | Tax Assessment Tax Assessment Total Assessment is a certain percentage of the fair market value that is determined by local assessors to be the total taxable value of land and additions on the property. | Land | Improvement |
|---|---|---|---|---|
| 2025 | $2,587 | $151,600 | $0 | $0 |
| 2024 | $2,587 | $136,700 | $0 | $0 |
| 2023 | $2,754 | $116,300 | $0 | $0 |
| 2022 | $2,578 | $102,600 | $0 | $0 |
| 2021 | $2,526 | $93,400 | $0 | $0 |
| 2020 | $2,096 | $88,900 | $0 | $0 |
| 2019 | $2,469 | $82,700 | $0 | $0 |
| 2018 | $2,401 | $71,500 | $0 | $0 |
| 2017 | $2,339 | $64,400 | $0 | $0 |
| 2016 | $2,265 | $60,700 | $0 | $0 |
| 2015 | $2,186 | $60,700 | $0 | $0 |
| 2013 | -- | $53,900 | $0 | $0 |
Source: Public Records
Map
Nearby Homes
- 4690 Stauffer Ave SE
- 5064 Maple Creek Ave SE
- 1720 Rondo St SE
- 5106 Bridle Creek Ct SE
- 4761 Kalamazoo Ave SE
- 5033 Stauffer Ave SE Unit 95
- 1229 44th St SE
- 1423 Mapleview St SE
- 5391 Ticonderoga Dr SE
- 5249 Newcastle Dr SE
- 2191 Wolfboro Dr SE
- 4215 Weymouth Dr SE
- 1238 Pickett St SE
- 1675 Langley St SE
- 4910 Weatherstone Ln SE
- 4324 Norman Dr SE Unit 14
- 1717 Gentian Dr SE
- 1441 Brookmark St SE
- 4889 Fuller Ave SE
- 5480 Cheryl Ave SE
- 1947 Rondo St SE
- 1921 Rondo St SE
- 1934 Rondo St SE
- 1944 Rondo St SE
- 1924 Rondo St SE
- 1911 Rondo St SE
- 1914 Rondo St SE
- 1955 Rondo St SE
- 1933 Andrew St SE
- 1943 Andrew St SE
- 1901 Rondo St SE
- 1959 Rondo St SE
- 1923 Andrew St SE
- 1904 Rondo St SE
- 1913 Andrew St SE
- 1963 Rondo St SE
- 2011 Andrew St SE Unit 2013
- 1900 Gerda St SE
- 4753 Circle Shore Dr SE
- 1859 Rondo St SE