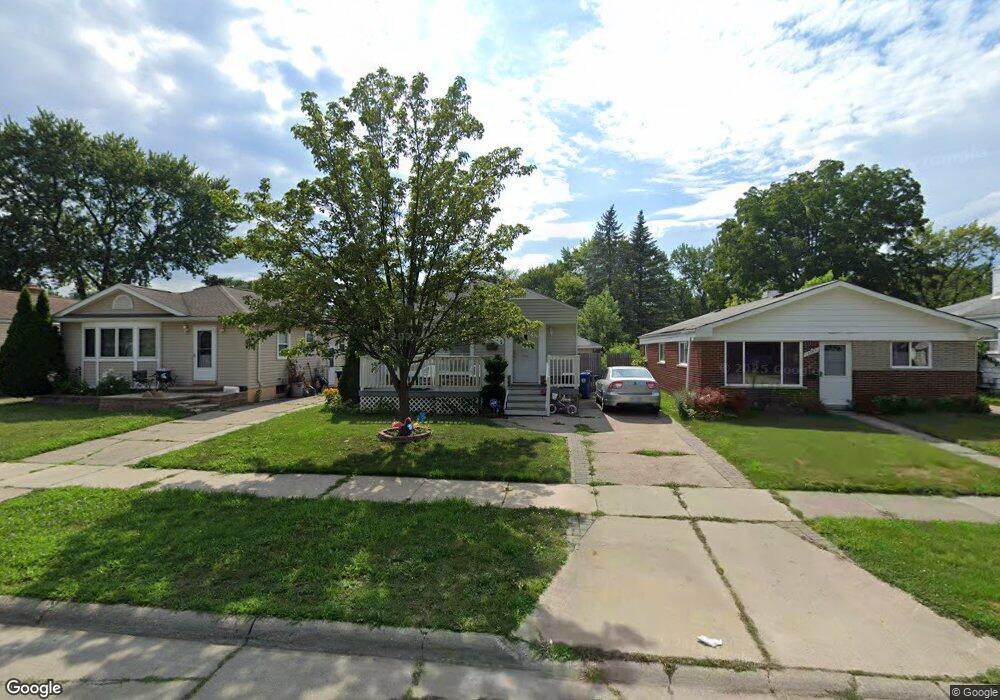
19375 Kinloch Redford, MI 48240
Estimated Value: $159,000 - $182,000
3
Beds
1
Bath
1,000
Sq Ft
$167/Sq Ft
Est. Value
About This Home
This home is located at 19375 Kinloch, Redford, MI 48240 and is currently estimated at $166,591, approximately $166 per square foot. 19375 Kinloch is a home located in Wayne County with nearby schools including Beech Elementary School, Hilbert Elementary School, and David Ellis Academy West.
Ownership History
Date
Name
Owned For
Owner Type
Purchase Details
Closed on
Jun 9, 2011
Sold by
Sweet Samuel D and Estate Of Gordon Dale Rooker
Bought by
Dimovski Mike Paul
Current Estimated Value
Purchase Details
Closed on
Jun 8, 2011
Sold by
Sweet Samuel D and The Estate Of Gordon Dale Rook
Bought by
Dimovski Mike Paul
Purchase Details
Closed on
May 19, 2011
Sold by
Rooker Scot D and Rooker Tina
Bought by
Sweet Samuel D and The Estate Of Gordon Dale Rook
Purchase Details
Closed on
Oct 5, 2009
Sold by
Ultra Contracting Llc
Bought by
Rooker Gordon D
Purchase Details
Closed on
Jan 29, 2009
Sold by
Hodgson Cayce
Bought by
Ultra Contracting Llc
Purchase Details
Closed on
Jul 20, 2006
Sold by
Federal Home Loan Mortgage Corporation
Bought by
Hodgson Cayce
Purchase Details
Closed on
Aug 24, 2005
Sold by
Ayers Richard A and Ayers Kelly J
Bought by
Federal Home Loan Mortgage Corporation
Purchase Details
Closed on
Apr 12, 1996
Sold by
Ayer Richard A and Ayer Kelly J
Bought by
Alice R Parrinello
Create a Home Valuation Report for This Property
The Home Valuation Report is an in-depth analysis detailing your home's value as well as a comparison with similar homes in the area
Home Values in the Area
Average Home Value in this Area
Purchase History
| Date | Buyer | Sale Price | Title Company |
|---|---|---|---|
| Dimovski Mike Paul | $57,000 | Select Title Company | |
| Dimovski Mike Paul | -- | None Available | |
| Sweet Samuel D | -- | None Available | |
| Rooker Gordon D | -- | None Available | |
| Ultra Contracting Llc | $30,000 | Title One Inc | |
| Hodgson Cayce | $79,500 | Attorneys Title Agency Llc | |
| Federal Home Loan Mortgage Corporation | $133,525 | None Available | |
| Alice R Parrinello | $65,000 | -- |
Source: Public Records
Tax History Compared to Growth
Tax History
| Year | Tax Paid | Tax Assessment Tax Assessment Total Assessment is a certain percentage of the fair market value that is determined by local assessors to be the total taxable value of land and additions on the property. | Land | Improvement |
|---|---|---|---|---|
| 2025 | $579 | $69,100 | $0 | $0 |
| 2024 | $579 | $61,200 | $0 | $0 |
| 2023 | $552 | $53,700 | $0 | $0 |
| 2022 | $2,441 | $48,100 | $0 | $0 |
| 2021 | $1,887 | $43,300 | $0 | $0 |
| 2020 | $1,603 | $35,500 | $0 | $0 |
| 2019 | $1,643 | $33,100 | $0 | $0 |
| 2018 | $498 | $23,600 | $0 | $0 |
| 2017 | $1,802 | $23,300 | $0 | $0 |
| 2016 | $1,207 | $21,800 | $0 | $0 |
| 2015 | $1,788 | $19,800 | $0 | $0 |
| 2013 | $1,750 | $18,100 | $0 | $0 |
| 2012 | $1,742 | $21,400 | $6,200 | $15,200 |
Source: Public Records
Map
Nearby Homes
- 19394 Woodworth
- 19203 Kinloch
- 19347 Woodworth
- 19336 Centralia
- 19430 Lexington
- 19150 Lexington
- 19495 Lexington
- 19412 Gaylord
- 19946 Kinloch
- 19941 Woodworth
- 19958 Norborne
- 26802 Vassar Ave
- 19551 Imperial Hwy
- 18604 Wakenden
- 20005 Woodworth
- 19701 Sumner
- 19550 Imperial Hwy
- 19930 Gaylord
- 18846 Fox
- 18696 Gaylord
- 19383 Kinloch
- 19367 Kinloch
- 19389 Kinloch
- 19359 Kinloch
- 19397 Kinloch
- 19353 Kinloch
- 19376 Woodworth
- 19388 Woodworth
- 19366 Woodworth
- 19349 Kinloch
- 19356 Woodworth
- 19354 Woodworth
- 19376 Kinloch Unit Bldg-Unit
- 19376 Kinloch
- 19368 Kinloch
- 19386 Kinloch
- 19341 Kinloch
- 19360 Kinloch
- 19392 Kinloch
- 19348 Woodworth