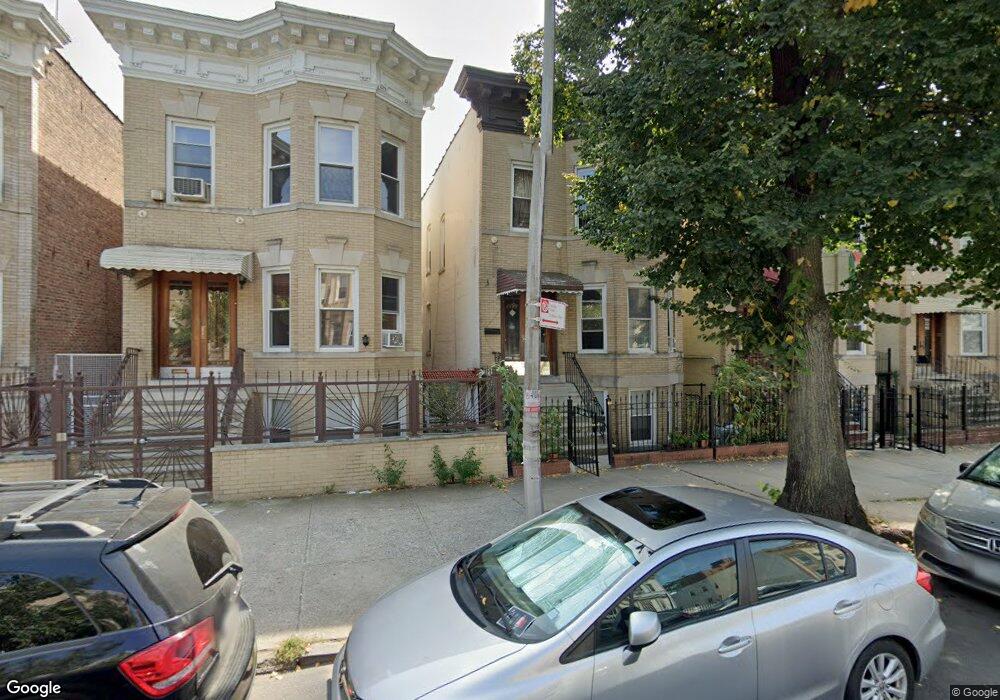
1938 Benedict Ave Bronx, NY 10462
Parkchester NeighborhoodEstimated Value: $867,191 - $1,200,000
Studio
--
Bath
3,704
Sq Ft
$294/Sq Ft
Est. Value
About This Home
This home is located at 1938 Benedict Ave, Bronx, NY 10462 and is currently estimated at $1,087,798, approximately $293 per square foot. 1938 Benedict Ave is a home located in Bronx County with nearby schools including P.S. 106 - Parkchester, M.S. 127 - The Castle Hill Middle School, and St Helena School.
Ownership History
Date
Name
Owned For
Owner Type
Purchase Details
Closed on
Nov 21, 2003
Sold by
Akhuemokhan Mary
Bought by
Zaman Rehanuz
Current Estimated Value
Home Financials for this Owner
Home Financials are based on the most recent Mortgage that was taken out on this home.
Original Mortgage
$337,500
Outstanding Balance
$156,575
Interest Rate
6.01%
Mortgage Type
Purchase Money Mortgage
Estimated Equity
$931,223
Purchase Details
Closed on
Feb 25, 2002
Sold by
Emelumadu Uche
Bought by
Akhuemokhan Mary
Home Financials for this Owner
Home Financials are based on the most recent Mortgage that was taken out on this home.
Original Mortgage
$312,518
Interest Rate
7.04%
Purchase Details
Closed on
Sep 20, 2001
Sold by
Butera Marie and Logalbo Josephine
Bought by
Emelumadu Uche
Home Financials for this Owner
Home Financials are based on the most recent Mortgage that was taken out on this home.
Original Mortgage
$200,000
Interest Rate
6.77%
Create a Home Valuation Report for This Property
The Home Valuation Report is an in-depth analysis detailing your home's value as well as a comparison with similar homes in the area
Home Values in the Area
Average Home Value in this Area
Purchase History
| Date | Buyer | Sale Price | Title Company |
|---|---|---|---|
| Zaman Rehanuz | $375,000 | -- | |
| Akhuemokhan Mary | -- | -- | |
| Emelumadu Uche | -- | -- |
Source: Public Records
Mortgage History
| Date | Status | Borrower | Loan Amount |
|---|---|---|---|
| Open | Zaman Rehanuz | $337,500 | |
| Previous Owner | Akhuemokhan Mary | $312,518 | |
| Previous Owner | Emelumadu Uche | $200,000 |
Source: Public Records
Tax History
| Year | Tax Paid | Tax Assessment Tax Assessment Total Assessment is a certain percentage of the fair market value that is determined by local assessors to be the total taxable value of land and additions on the property. | Land | Improvement |
|---|---|---|---|---|
| 2025 | $7,531 | $39,746 | $6,386 | $33,360 |
| 2024 | $7,531 | $37,498 | $6,527 | $30,971 |
| 2023 | $7,615 | $37,498 | $6,660 | $30,838 |
| 2022 | $7,429 | $49,320 | $9,900 | $39,420 |
| 2021 | $7,389 | $46,740 | $9,900 | $36,840 |
| 2020 | $7,011 | $50,520 | $9,900 | $40,620 |
| 2019 | $6,537 | $40,740 | $9,900 | $30,840 |
| 2018 | $6,370 | $31,248 | $6,939 | $24,309 |
| 2017 | $6,322 | $31,013 | $9,187 | $21,826 |
| 2016 | $5,849 | $29,258 | $8,266 | $20,992 |
| 2015 | $3,680 | $27,602 | $8,000 | $19,602 |
| 2014 | $3,680 | $26,040 | $9,060 | $16,980 |
Source: Public Records
Map
Nearby Homes
- 1926 Mcgraw Ave
- 1332 Metropolitan Ave Unit 6A
- 1332 Metropolitan Ave Unit 2A
- 1332 Metropolitan Ave Unit 3H
- 1332 Metropolitan Ave Unit 5G
- 1922 Mcgraw Ave Unit 6I
- 2012 Benedict Ave
- 1521 Unionport Rd Unit 11G
- 1521 Unionport Rd Unit 11A
- 1450 Parkchester Rd Unit 3H
- 2053 Mcgraw Ave Unit 4E
- 1470 East Ave Unit 5G
- 1480 Parkchester Rd
- 1966 Newbold Ave Unit 108
- 1966 Newbold Ave Unit 1510
- 1966 Newbold Ave Unit 1502
- 1966 Newbold Ave Unit 505
- 1966 Newbold Ave Unit 408
- 1966 Newbold Ave Unit 904
- 1966 Newbold Ave Unit 1109
- 1940 Benedict Ave
- 1936 Benedict Ave
- 1944 Benedict Ave
- 1934 Benedict Ave
- 1946 Benedict Ave
- 1930 Benedict Ave
- 1948 Benedict Ave
- 1928 Benedict Ave
- 1945-1955 Westchester Ave
- 1935-1941 Westchester Ave
- 1924 Benedict Ave
- 1957 Westchester Ave
- 1939 Benedict Ave
- 1937 Benedict Ave
- 1959 Westchester Ave
- 1952 Benedict Ave
- 1941 Benedict Ave
- 1931 Benedict Ave
- 1920 Benedict Ave
- 1921-1929 Westchester Ave
Your Personal Tour Guide
Ask me questions while you tour the home.