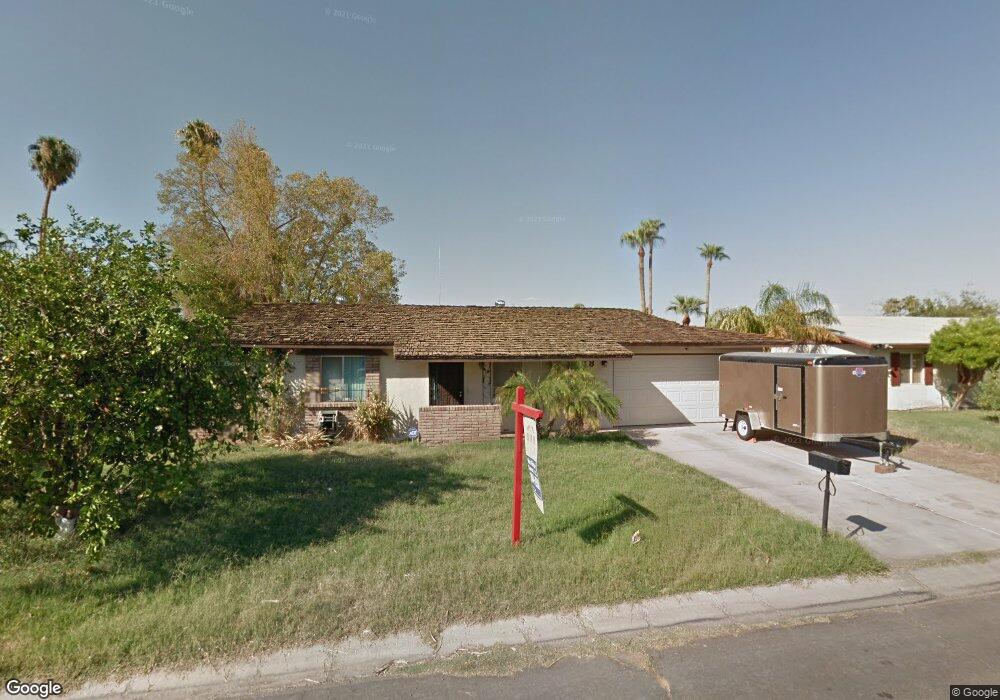
1938 W Allen St Yuma, AZ 85364
El Pueblocito NeighborhoodEstimated Value: $278,000 - $303,322
4
Beds
2
Baths
1,812
Sq Ft
$160/Sq Ft
Est. Value
About This Home
This home is located at 1938 W Allen St, Yuma, AZ 85364 and is currently estimated at $290,331, approximately $160 per square foot. 1938 W Allen St is a home located in Yuma County with nearby schools including Salida Del Sol Elementary School, Rancho Viejo Elementary School, and Centennial Middle School.
Ownership History
Date
Name
Owned For
Owner Type
Purchase Details
Closed on
Aug 3, 2012
Sold by
Fannie Mae
Bought by
Navarro John and Navarro Jessica
Current Estimated Value
Home Financials for this Owner
Home Financials are based on the most recent Mortgage that was taken out on this home.
Original Mortgage
$102,029
Outstanding Balance
$71,735
Interest Rate
3.99%
Mortgage Type
FHA
Estimated Equity
$218,596
Purchase Details
Closed on
May 21, 2012
Sold by
Larson John and Larson Tiffany
Bought by
Federal National Mortgage Association
Purchase Details
Closed on
Jan 15, 2008
Sold by
Webb Wanda Lanell and Webb Marcel K
Bought by
Larson John and Larson Tiffany
Home Financials for this Owner
Home Financials are based on the most recent Mortgage that was taken out on this home.
Original Mortgage
$170,905
Interest Rate
5.41%
Mortgage Type
FHA
Create a Home Valuation Report for This Property
The Home Valuation Report is an in-depth analysis detailing your home's value as well as a comparison with similar homes in the area
Home Values in the Area
Average Home Value in this Area
Purchase History
| Date | Buyer | Sale Price | Title Company |
|---|---|---|---|
| Navarro John | $105,000 | Title Security | |
| Federal National Mortgage Association | $139,025 | First American Title | |
| Larson John | $179,900 | Title Security |
Source: Public Records
Mortgage History
| Date | Status | Borrower | Loan Amount |
|---|---|---|---|
| Open | Navarro John | $102,029 | |
| Previous Owner | Larson John | $170,905 |
Source: Public Records
Tax History Compared to Growth
Tax History
| Year | Tax Paid | Tax Assessment Tax Assessment Total Assessment is a certain percentage of the fair market value that is determined by local assessors to be the total taxable value of land and additions on the property. | Land | Improvement |
|---|---|---|---|---|
| 2025 | $1,448 | $13,121 | $2,353 | $10,768 |
| 2024 | $1,385 | $12,496 | $2,356 | $10,140 |
| 2023 | $1,385 | $11,901 | $2,165 | $9,736 |
| 2022 | $1,334 | $11,334 | $2,453 | $8,881 |
| 2021 | $1,398 | $10,795 | $2,256 | $8,539 |
| 2020 | $1,359 | $10,280 | $1,676 | $8,604 |
| 2019 | $1,338 | $9,791 | $2,356 | $7,435 |
| 2018 | $1,240 | $9,325 | $2,373 | $6,952 |
| 2017 | $1,216 | $9,325 | $2,373 | $6,952 |
| 2016 | $1,171 | $8,458 | $1,709 | $6,749 |
| 2015 | $992 | $8,055 | $1,775 | $6,280 |
| 2014 | $992 | $7,916 | $2,000 | $5,916 |
Source: Public Records
Map
Nearby Homes
- 2042 S Coyote Ave
- 1910 S 17th Ave
- 1805 S Dora Ave
- 1887 S Mckinley Ave
- 1746 W Camino Tierra
- 1950 S Ridgeview Dr
- 1925 S Ridgeview Dr
- 2161 S Sidewinder Ave
- 1404 W Parkway Dr
- 1425 W 18th Place
- 1700 S Crowder Ave
- 1903 W Camino Soledad
- 1319 W 18 Place
- 2045 S 14th Ave
- 1766 W Camino Kino
- 1645 W El Paseo Real
- 1721 W Camino Soledad
- 2402 W 16th St Unit C1
- 2402 W 16th St Unit B3
- 2402 W 16th St Unit A5
- 1919 S Dora Ave
- 1932 W Allen St
- 1935 W 19th Place
- 1933 W 19th Place
- 1939 W 19th Place
- 1930 W Allen St
- 1931 W Allen St
- 1927 W Allen St
- 1943 W Allen St
- 1929 W 19th Place
- 1923 W Allen St
- 1920 W Allen St
- 1920 S Dora Ave
- 1916 S Dora Ave
- 1924 S Dora Ave
- 1925 W 19th Place
- 1936 W 19th Place
- 1912 S Dora Ave
- 1926 W 19th Place
- 1919 W Allen St