W
Seller's Agent in 2015
Wilma Dearybury
OTHER
Estimated Value: $312,000 - $416,000
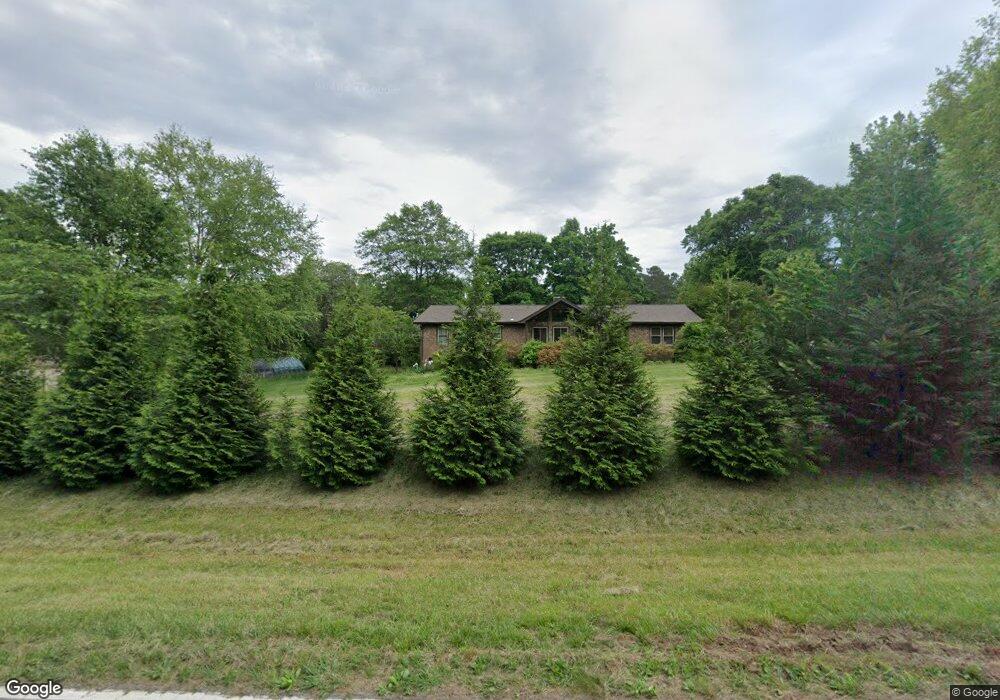
BEAUTIFUL 4 bedroom, 2.5 bath Ranch Home on a 1+acre COUNTRY SETTING! This home has been nearly completely remodeled with a gorgeous kitchen with bay window, quartz countertop island and breakfast bar, all stainless appliances. The spacious family room with vaulted ceiling and stone fireplace opens to the bright sunroom overlooking the inground pool and deck. The master bedroom has a sitting area, gas log fireplace, and full bath complete with Jacuzzi and separate shower. The 4th bedroom currently used as an office would make a perfect nursery for a growing family. This home has two master bedrooms, formal dining, 2 gas log fireplaces, new replacement windows, and a large mud room with half bath with easy access to the pool area. Beautiful updated hall bath with footed tub, & large ceramic tile shower serves the secondary bedrooms. Located in Award Winning District Three Schools, convenient to I-85, schools, and shopping!
| Date | Buyer | Sale Price | Title Company |
|---|---|---|---|
| Vassey Jean L | -- | -- |
| Date | Event | Price | List to Sale | Price per Sq Ft | Prior Sale |
|---|---|---|---|---|---|
| 12/15/2015 12/15/15 | Sold | $174,000 | -12.6% | $65 / Sq Ft | View Prior Sale |
| 10/15/2015 10/15/15 | Pending | -- | -- | -- | |
| 07/14/2015 07/14/15 | For Sale | $199,000 | -- | $75 / Sq Ft |
| Year | Tax Paid | Tax Assessment Tax Assessment Total Assessment is a certain percentage of the fair market value that is determined by local assessors to be the total taxable value of land and additions on the property. | Land | Improvement |
|---|---|---|---|---|
| 2025 | $1,316 | $9,205 | $626 | $8,579 |
| 2024 | $1,316 | $9,205 | $626 | $8,579 |
| 2023 | $1,316 | $9,205 | $626 | $8,579 |
| 2022 | $1,131 | $8,004 | $594 | $7,410 |
| 2021 | $1,131 | $8,004 | $594 | $7,410 |
| 2020 | $1,112 | $8,004 | $594 | $7,410 |
| 2019 | $1,278 | $8,004 | $594 | $7,410 |
| 2018 | $1,045 | $8,004 | $594 | $7,410 |
| 2017 | $814 | $6,960 | $604 | $6,356 |
| 2016 | $814 | $6,960 | $604 | $6,356 |
| 2015 | $1,103 | $6,880 | $604 | $6,276 |
| 2014 | $1,098 | $6,880 | $604 | $6,276 |
W
Seller's Agent in 2015
Wilma Dearybury
OTHER
