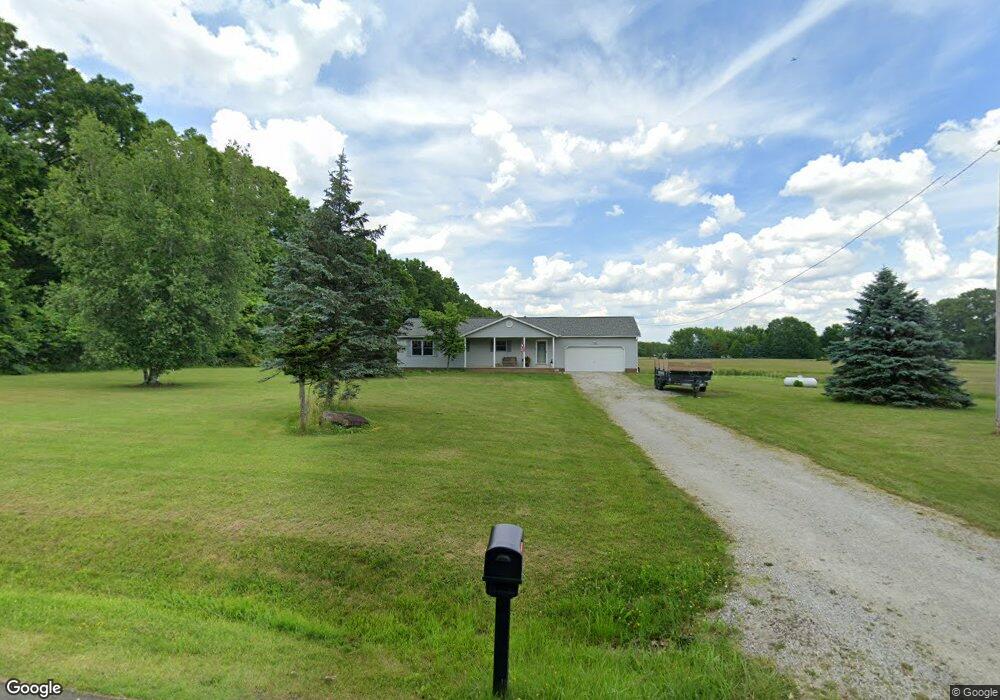
1939 Johns Rd New Franklin, OH 44216
Estimated Value: $240,000 - $277,000
2
Beds
2
Baths
1,144
Sq Ft
$220/Sq Ft
Est. Value
About This Home
This home is located at 1939 Johns Rd, New Franklin, OH 44216 and is currently estimated at $251,521, approximately $219 per square foot. 1939 Johns Rd is a home located in Summit County with nearby schools including Northwest Primary School, W.S. Stinson Elementary School, and Northwest Middle School.
Ownership History
Date
Name
Owned For
Owner Type
Purchase Details
Closed on
May 10, 2024
Sold by
Lawrentz Keith Dale and Swann William R
Bought by
Kulcsar Daniel T and Kulcsar Sylvia M
Current Estimated Value
Home Financials for this Owner
Home Financials are based on the most recent Mortgage that was taken out on this home.
Original Mortgage
$212,657
Outstanding Balance
$209,624
Interest Rate
6.79%
Mortgage Type
Credit Line Revolving
Estimated Equity
$41,897
Purchase Details
Closed on
May 9, 2024
Sold by
Lawrentz Keith Dale and Swann William R
Bought by
Kulcsar Daniel T and Kulcsar Sylvia M
Home Financials for this Owner
Home Financials are based on the most recent Mortgage that was taken out on this home.
Original Mortgage
$212,657
Outstanding Balance
$209,624
Interest Rate
6.79%
Mortgage Type
Credit Line Revolving
Estimated Equity
$41,897
Purchase Details
Closed on
Oct 5, 2005
Sold by
Lawrentz Cathe and Lawrentz Keith D
Bought by
Lawrentz Keith D and Lawrentz Cathe
Home Financials for this Owner
Home Financials are based on the most recent Mortgage that was taken out on this home.
Original Mortgage
$127,298
Interest Rate
5.75%
Mortgage Type
New Conventional
Create a Home Valuation Report for This Property
The Home Valuation Report is an in-depth analysis detailing your home's value as well as a comparison with similar homes in the area
Home Values in the Area
Average Home Value in this Area
Purchase History
| Date | Buyer | Sale Price | Title Company |
|---|---|---|---|
| Kulcsar Daniel T | $240,000 | None Listed On Document | |
| Kulcsar Daniel T | $240,000 | None Listed On Document | |
| Lawrentz Keith D | -- | Cathcor Title Agency Inc |
Source: Public Records
Mortgage History
| Date | Status | Borrower | Loan Amount |
|---|---|---|---|
| Open | Kulcsar Daniel T | $212,657 | |
| Closed | Kulcsar Daniel T | $212,657 | |
| Previous Owner | Lawrentz Keith D | $127,298 |
Source: Public Records
Tax History
| Year | Tax Paid | Tax Assessment Tax Assessment Total Assessment is a certain percentage of the fair market value that is determined by local assessors to be the total taxable value of land and additions on the property. | Land | Improvement |
|---|---|---|---|---|
| 2025 | $2,724 | $70,704 | $23,391 | $47,313 |
| 2024 | $2,724 | $70,704 | $23,391 | $47,313 |
| 2023 | $2,724 | $70,704 | $23,391 | $47,313 |
| 2022 | $2,130 | $52,371 | $17,325 | $35,046 |
| 2021 | $2,135 | $52,371 | $17,325 | $35,046 |
| 2020 | $2,141 | $52,380 | $17,330 | $35,050 |
| 2019 | $1,665 | $41,430 | $17,330 | $24,100 |
| 2018 | $1,664 | $41,430 | $17,330 | $24,100 |
| 2017 | $1,542 | $41,430 | $17,330 | $24,100 |
| 2016 | $1,518 | $36,810 | $17,330 | $19,480 |
| 2015 | $1,542 | $36,810 | $17,330 | $19,480 |
| 2014 | $1,610 | $36,810 | $17,330 | $19,480 |
| 2013 | $1,709 | $38,510 | $17,330 | $21,180 |
Source: Public Records
Map
Nearby Homes
- 1548 Vanderhoof Rd
- 5200 Donner Dr
- 5336 Donner Dr
- 1365 Vanderhoof Rd
- 2670 Himelrigh Blvd
- 4698 Manchester Rd
- 5245 Monroe Square E
- 6670 Kepler Rd
- V/L Monroe Square
- 5259 Frederick St
- V/L Bishop Oval
- 692 Zeletta Dr
- 6090 Manchester Rd Unit 6096
- 752 Leeman Dr
- 1069 W Nimisila Rd
- 4352 W Hohman Cir
- 442 Frank Ave
- 5838 Harter Home Dr
- 5638 Bonnie Lou Dr
- 303 George St
Your Personal Tour Guide
Ask me questions while you tour the home.