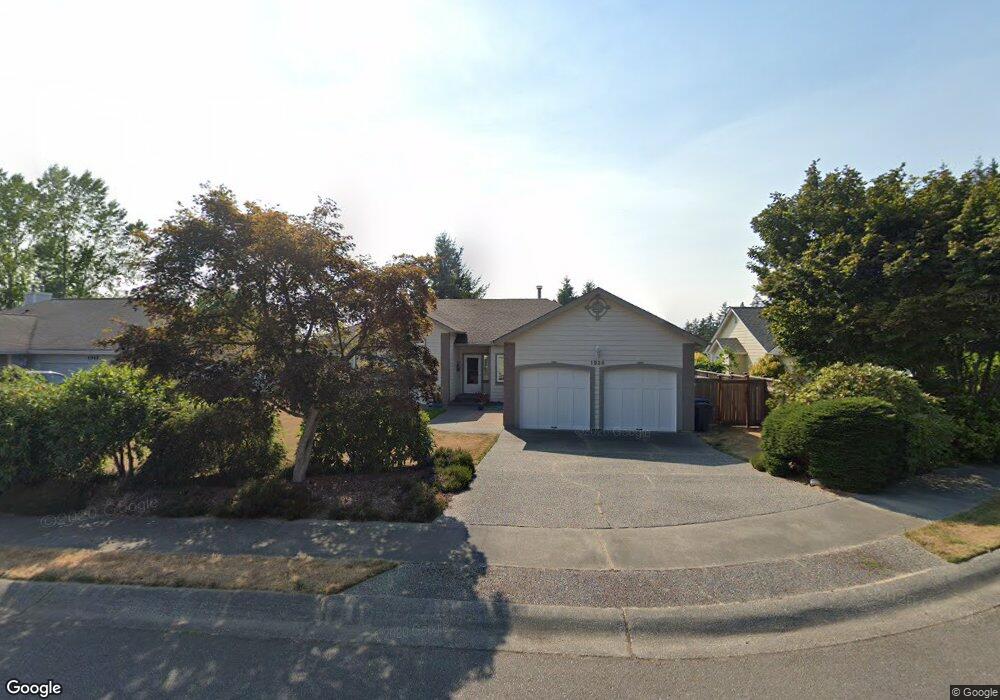
1939 NE Laurie Vei Loop Poulsbo, WA 98370
Estimated Value: $676,000 - $803,000
3
Beds
3
Baths
1,892
Sq Ft
$378/Sq Ft
Est. Value
About This Home
This home is located at 1939 NE Laurie Vei Loop, Poulsbo, WA 98370 and is currently estimated at $715,596, approximately $378 per square foot. 1939 NE Laurie Vei Loop is a home located in Kitsap County with nearby schools including Poulsbo Elementary School, Poulsbo Middle School, and North Kitsap High School.
Ownership History
Date
Name
Owned For
Owner Type
Purchase Details
Closed on
Jan 26, 2015
Sold by
Phillips Bernice M
Bought by
Phillips Bernice M and Jenkins Lailey H
Current Estimated Value
Purchase Details
Closed on
Jun 9, 2000
Sold by
Williams John F
Bought by
Phillips Bernice M
Purchase Details
Closed on
Jan 1, 1998
Sold by
Stallings Margaret R
Bought by
Williams John F
Purchase Details
Closed on
Dec 27, 1994
Sold by
Cooke Barton S and Cooke Becky J
Bought by
Williams John F and Stallings Margaret R
Home Financials for this Owner
Home Financials are based on the most recent Mortgage that was taken out on this home.
Original Mortgage
$123,950
Interest Rate
3.5%
Create a Home Valuation Report for This Property
The Home Valuation Report is an in-depth analysis detailing your home's value as well as a comparison with similar homes in the area
Home Values in the Area
Average Home Value in this Area
Purchase History
| Date | Buyer | Sale Price | Title Company |
|---|---|---|---|
| Phillips Bernice M | -- | None Available | |
| Phillips Bernice M | $235,000 | Land Title Company | |
| Phillips Bernice M | -- | Land Title Company | |
| Williams John F | $82,957 | Chicago Title Insurance Co | |
| Williams John F | $1,889 | Land Title Co |
Source: Public Records
Mortgage History
| Date | Status | Borrower | Loan Amount |
|---|---|---|---|
| Previous Owner | Williams John F | $123,950 |
Source: Public Records
Tax History Compared to Growth
Tax History
| Year | Tax Paid | Tax Assessment Tax Assessment Total Assessment is a certain percentage of the fair market value that is determined by local assessors to be the total taxable value of land and additions on the property. | Land | Improvement |
|---|---|---|---|---|
| 2026 | $6,202 | $704,940 | $205,070 | $499,870 |
| 2025 | $6,202 | $704,940 | $205,070 | $499,870 |
| 2024 | $5,680 | $665,480 | $169,830 | $495,650 |
| 2023 | $5,776 | $665,480 | $169,830 | $495,650 |
| 2022 | $5,122 | $562,110 | $147,430 | $414,680 |
| 2021 | $4,943 | $502,600 | $132,090 | $370,510 |
| 2020 | $4,796 | $479,530 | $126,200 | $353,330 |
| 2019 | $4,490 | $449,190 | $117,940 | $331,250 |
| 2018 | $4,343 | $369,950 | $92,480 | $277,470 |
| 2017 | $4,146 | $369,950 | $92,480 | $277,470 |
| 2016 | $4,260 | $350,000 | $92,480 | $257,520 |
| 2015 | $4,126 | $340,930 | $92,480 | $248,450 |
| 2014 | -- | $328,240 | $92,480 | $235,760 |
| 2013 | -- | $328,240 | $92,480 | $235,760 |
Source: Public Records
Map
Nearby Homes
- 1776 Bungalow Way NE
- 19546 23rd Ave NE
- 2776 NE Noll Valley Loop
- 29 Beargrass Ln NE
- 35 Beargrass Ln NE
- 20249 State Highway 305 NE
- 123 Pugh Rd NE
- 19680 Noll Rd NE
- 20156 Vikings Crest NE Unit 7-304
- 456 Little Valley Rd NE
- 20161 Vikings Crest Loop NE Unit 5-106
- 20050 Vikings Crest Loop NE Unit 2-301
- 20026 Vikings Crest NE Unit 1-102
- 18552 15th Loop NE
- 19795 4th Ave NE
- 0 Bond Rd NE
- 0 7th Ave NE Unit NWM2459196
- 0 7th Ave NE Unit NWM2280996
- 2413 NE Sunnymede St
- 19463 Scoter Ln NE
- 1945 NE Laurie Vei Loop
- 1933 NE Laurie Vei Loop
- 1968 NE Laurie Vei Loop
- 1927 NE Laurie Vei Loop
- 1951 NE Laurie Vei Loop
- 1921 NE Laurie Vei Loop
- 19956 Emerson Ave NE Unit 11
- 1957 NE Laurie Vei Loop
- 1962 NE Laurie Vei Loop
- 1974 NE Laurie Vei Loop
- 1963 NE Laurie Vei Loop
- 1928 NE Hogue Ct
- 1930 NE Hogue Ct
- 1915 NE Laurie Vei Loop
- 19948 Emerson Ave NE Unit 13
- 1969 NE Laurie Vei Loop
- 1909 NE Laurie Vei Loop
- 199952 Emerson Ave NE Unit 12
- 1618 NE Calavista St Unit 10
- 1766 Bungalow Way NE Unit 15