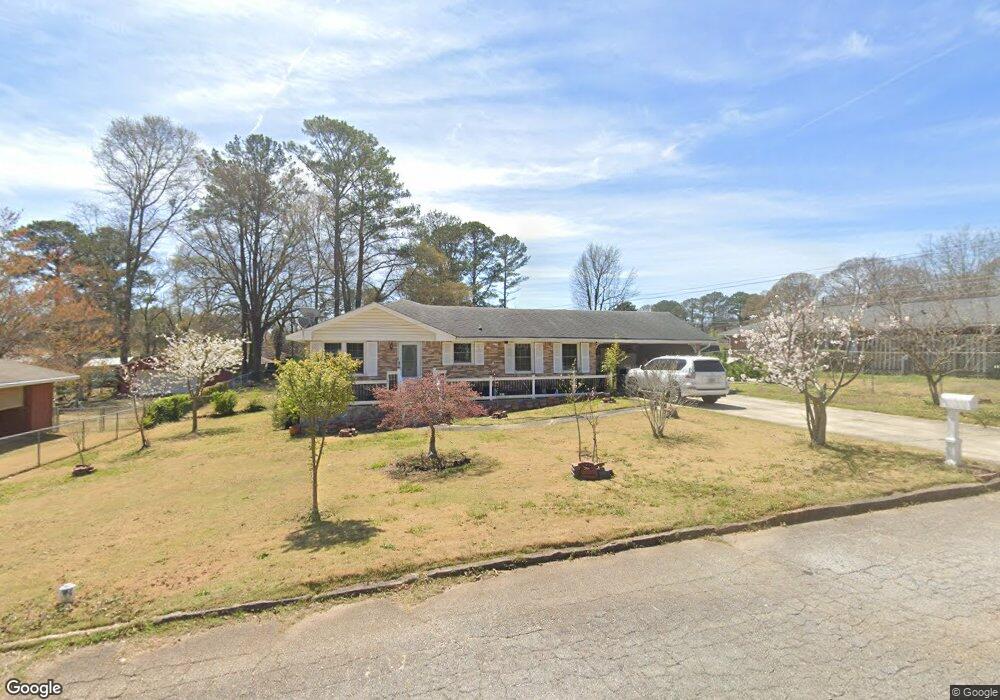
1939 Pinecrest Dr Morrow, GA 30260
Estimated Value: $177,280 - $265,000
3
Beds
2
Baths
1,400
Sq Ft
$156/Sq Ft
Est. Value
About This Home
This home is located at 1939 Pinecrest Dr, Morrow, GA 30260 and is currently estimated at $218,070, approximately $155 per square foot. 1939 Pinecrest Dr is a home located in Clayton County with nearby schools including Morrow Elementary School, Morrow Middle School, and Morrow High School.
Ownership History
Date
Name
Owned For
Owner Type
Purchase Details
Closed on
Nov 26, 2019
Sold by
Tran Anh Tai Dac
Bought by
Tran Anh Tai Dac and Nguyen Phuong T
Current Estimated Value
Purchase Details
Closed on
Jul 11, 2008
Sold by
Rcs Reo I Llc
Bought by
Huynh Anh
Home Financials for this Owner
Home Financials are based on the most recent Mortgage that was taken out on this home.
Original Mortgage
$90,000
Interest Rate
6.27%
Mortgage Type
New Conventional
Purchase Details
Closed on
Apr 1, 2008
Sold by
Hicks Alfonza and Hicks Leslie
Bought by
Rcs Reo I Llc
Purchase Details
Closed on
Feb 23, 2007
Sold by
Trey H Walker
Bought by
Hicks Leslie and Hicks Alfonza
Home Financials for this Owner
Home Financials are based on the most recent Mortgage that was taken out on this home.
Original Mortgage
$125,100
Interest Rate
10.3%
Mortgage Type
New Conventional
Create a Home Valuation Report for This Property
The Home Valuation Report is an in-depth analysis detailing your home's value as well as a comparison with similar homes in the area
Home Values in the Area
Average Home Value in this Area
Purchase History
| Date | Buyer | Sale Price | Title Company |
|---|---|---|---|
| Tran Anh Tai Dac | -- | -- | |
| Huynh Anh | $100,000 | -- | |
| Rcs Reo I Llc | $110,000 | -- | |
| Hicks Leslie | $139,900 | -- |
Source: Public Records
Mortgage History
| Date | Status | Borrower | Loan Amount |
|---|---|---|---|
| Previous Owner | Huynh Anh | $90,000 | |
| Previous Owner | Hicks Leslie | $125,100 |
Source: Public Records
Tax History
| Year | Tax Paid | Tax Assessment Tax Assessment Total Assessment is a certain percentage of the fair market value that is determined by local assessors to be the total taxable value of land and additions on the property. | Land | Improvement |
|---|---|---|---|---|
| 2025 | $768 | $62,760 | $8,000 | $54,760 |
| 2024 | $819 | $62,440 | $8,000 | $54,440 |
| 2023 | $2,269 | $57,480 | $8,000 | $49,480 |
| 2022 | $551 | $48,040 | $8,000 | $40,040 |
| 2021 | $415 | $38,160 | $8,000 | $30,160 |
| 2020 | $412 | $37,315 | $8,000 | $29,315 |
| 2019 | $419 | $36,844 | $6,400 | $30,444 |
| 2018 | $449 | $38,816 | $6,400 | $32,416 |
| 2017 | $409 | $34,623 | $6,400 | $28,223 |
| 2016 | $383 | $33,105 | $6,400 | $26,705 |
| 2015 | $204 | $0 | $0 | $0 |
| 2014 | $146 | $19,829 | $6,400 | $13,429 |
Source: Public Records
Map
Nearby Homes
- 6541 Debbie Sue Ln
- 6532 Debbie Sue Ln
- 1802 Lake Harbin Rd
- 1893 Stratford Arms Dr
- 1804 Carla Dr
- 2117 Amish Ct
- 6495 Revena Dr
- 2275 Santa fe St Unit 25
- 1924 Mural Cir
- 6633 Cameron Rd
- 6186 Deans Way
- 6566 Melandre Dr
- 6168 Deans Way
- 6430 Oakleaf Way
- 1931 Cornell Way
- 1910 Old Rex Morrow Rd
- 6359 Lanier Rd
- 1865 Oxford Dr
- 2104 Murry Trail
- 6413 Maddox Rd
- 1949 Pinecrest Dr
- 6482 Pleasant Valley Dr
- 6492 Pleasant Valley Dr
- 6500 Pleasant Valley Dr
- 6491 Debbie Sue Ln
- 6481 Debbie Sue Ln
- 6472 Pleasant Valley Dr
- 1938 Pinecrest Dr
- 6499 Debbie Sue Ln
- 1940 Pine Valley Dr
- 1948 Pinecrest Dr
- 1950 Pine Valley Dr
- 6510 Pleasant Valley Dr
- 1958 Pinecrest Dr
- 6485 Pleasant Valley Dr
- 6466 Pleasant Valley Dr
- 6509 Debbie Sue Ln
- 6473 Pleasant Valley Dr
- 6497 Pleasant Valley Dr
- 6507 Pleasant Valley Dr
Your Personal Tour Guide
Ask me questions while you tour the home.