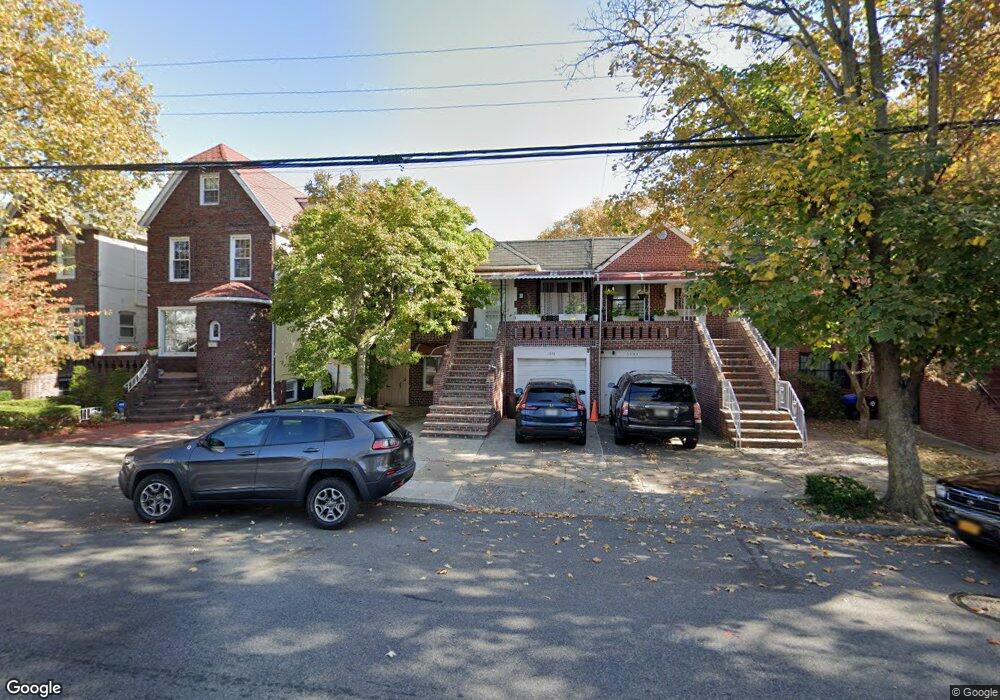
1939 Schenectady Ave Unit 2 Brooklyn, NY 11234
Flatlands NeighborhoodEstimated Value: $846,799 - $1,050,000
3
Beds
1
Bath
1,300
Sq Ft
$747/Sq Ft
Est. Value
About This Home
This home is located at 1939 Schenectady Ave Unit 2, Brooklyn, NY 11234 and is currently estimated at $970,950, approximately $746 per square foot. 1939 Schenectady Ave Unit 2 is a home located in Kings County with nearby schools including P.S. 203 Floyd Bennett, Midwood Catholic Academy, and Christian Heritage Academy.
Ownership History
Date
Name
Owned For
Owner Type
Purchase Details
Closed on
Mar 13, 2006
Sold by
Lochard Rolande
Bought by
Jacques Sabine C
Current Estimated Value
Home Financials for this Owner
Home Financials are based on the most recent Mortgage that was taken out on this home.
Original Mortgage
$533,850
Outstanding Balance
$300,242
Interest Rate
6.28%
Mortgage Type
Purchase Money Mortgage
Estimated Equity
$670,708
Purchase Details
Closed on
Sep 23, 2005
Sold by
Vlijter Deanna B
Bought by
Lochard Rolande
Home Financials for this Owner
Home Financials are based on the most recent Mortgage that was taken out on this home.
Original Mortgage
$96,000
Interest Rate
5.81%
Create a Home Valuation Report for This Property
The Home Valuation Report is an in-depth analysis detailing your home's value as well as a comparison with similar homes in the area
Home Values in the Area
Average Home Value in this Area
Purchase History
| Date | Buyer | Sale Price | Title Company |
|---|---|---|---|
| Jacques Sabine C | $600,000 | -- | |
| Jacques Sabine C | $600,000 | -- | |
| Lochard Rolande | $480,000 | -- | |
| Lochard Rolande | $480,000 | -- |
Source: Public Records
Mortgage History
| Date | Status | Borrower | Loan Amount |
|---|---|---|---|
| Open | Jacques Sabine C | $533,850 | |
| Closed | Jacques Sabine C | $533,850 | |
| Previous Owner | Lochard Rolande | $96,000 | |
| Previous Owner | Lochard Rolande | $336,000 |
Source: Public Records
Tax History Compared to Growth
Tax History
| Year | Tax Paid | Tax Assessment Tax Assessment Total Assessment is a certain percentage of the fair market value that is determined by local assessors to be the total taxable value of land and additions on the property. | Land | Improvement |
|---|---|---|---|---|
| 2025 | $8,433 | $52,860 | $12,360 | $40,500 |
| 2024 | $8,433 | $53,820 | $12,360 | $41,460 |
| 2023 | $7,307 | $51,060 | $12,360 | $38,700 |
| 2022 | $6,701 | $47,760 | $12,360 | $35,400 |
| 2021 | $6,650 | $43,800 | $12,360 | $31,440 |
| 2020 | $3,663 | $39,060 | $12,360 | $26,700 |
| 2019 | $7,271 | $39,060 | $12,360 | $26,700 |
| 2018 | $6,656 | $34,111 | $12,178 | $21,933 |
| 2017 | $6,260 | $32,181 | $10,278 | $21,903 |
| 2016 | $5,759 | $30,360 | $12,360 | $18,000 |
| 2015 | $3,498 | $31,440 | $13,740 | $17,700 |
| 2014 | $3,498 | $30,596 | $11,956 | $18,640 |
Source: Public Records
Map
Nearby Homes
- 1492 E 45th St
- 1414 E 51st St
- 1353 E 46th St
- 4811 Avenue J
- 1500 E 51st St
- 1566 E 49th St
- 4311 Avenue K
- 1563 E 46th St
- 2037 Schenectady Ave
- 1173 E 43rd St
- 1568 E 46th St
- 1573 E 45th St
- 4115 Hubbard Place
- 1511 E 51st St
- 2117 Troy Ave
- 1433 E 52nd St Unit 2B
- 2020 E 41st St Unit 2B
- 4809 Avenue M
- 4042 Hubbard Place
- 1278 E 53rd St Unit 1
- 1939 Schenectady Ave
- 1943 Schenectady Ave
- 1935 Schenectady Ave
- 1933 Schenectady Ave
- 1947 Schenectady Ave
- 4717 Flatlands Ave
- 1931 Schenectady Ave
- 1466 E 48th St
- 1464 E 48th St
- 1462 E 48th St
- 1476 E 48th St
- 1478 E 48th St
- 4706 Avenue K
- 4710 Avenue K
- 4704 Avenue K
- 4712 Avenue K
- 4702 Avenue K
- 4714 Avenue K
- 1940 Schenectady Ave
- 1944 Schenectady Ave