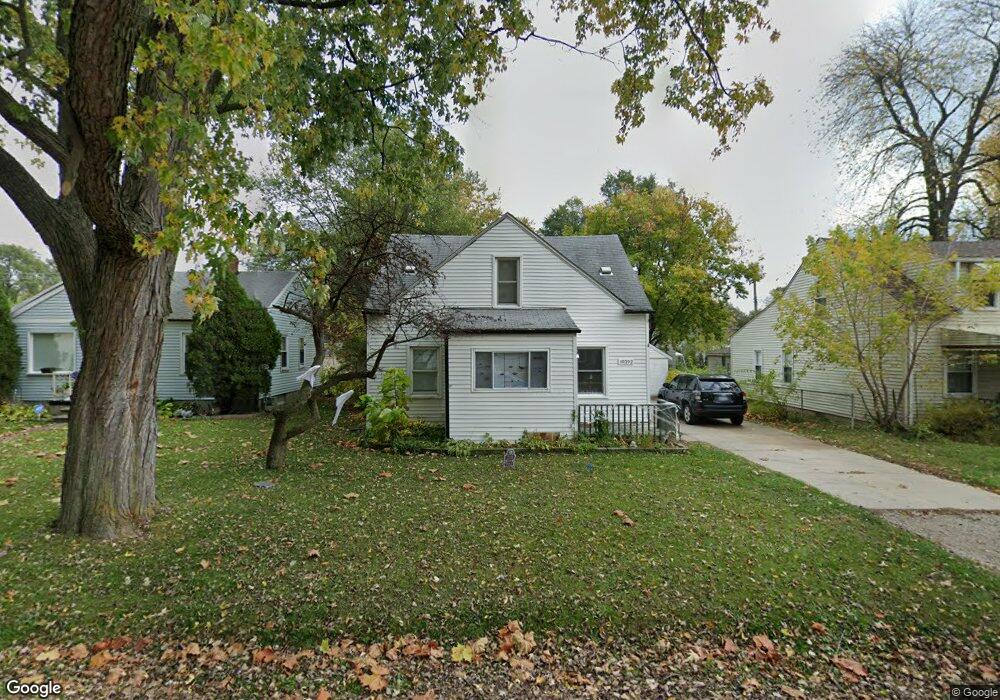
19392 Negaunee Redford, MI 48240
Estimated Value: $118,000 - $153,000
About This Home
Property Id: 64095
FOR LEASE - 12 MONTH LEASE (longer lease available also) $1300
Need to have 3 X rent gross income to apply MOVE IN IS 1st MONTHS RENT + 1.5 MONTHS SECURITY DEPOSIT
This spacious bungalow style home will wow you!
New paint
New flooring throughout
With3 bed rooms and a loft, exterior lighting, and open floor plan are just some of the amazing features of this home!
Enjoy relaxing in the fenced private y ard! Some features of this home include:
*3 Bedrooms/1 Bathroom
*1200 Sq. Ft. of Living Space
*Open Floor Plan
*Ceiling fans in all bedrooms
*quiet location
*1 + Car Garage
*plenty of storage/work bench
*1st floor Laundry / Utility Room (No Basement)
*Nice size lot
APPLIANCES
Washer and Dryer
Stove Refrigerator
UTILITIES
Tenant pays water, gas, and electric High-speed Internet
PET POLICY
No Cats or Dogs allowed
Email for extra photos, contact information, and make an appointment.
Text:
Ownership History
Purchase Details
Purchase Details
Home Values in the Area
Average Home Value in this Area
Purchase History
| Date | Buyer | Sale Price | Title Company |
|---|---|---|---|
| Zhang Zongfen | $15,500 | First Centennial Title Inc | |
| Gill Brandi D | $83,000 | Metropolitan Title Company |
Property History
| Date | Event | Price | List to Sale | Price per Sq Ft |
|---|---|---|---|---|
| 09/10/2025 09/10/25 | Off Market | $1,350 | -- | -- |
| 08/06/2025 08/06/25 | For Rent | $1,350 | -- | -- |
Tax History Compared to Growth
Tax History
| Year | Tax Paid | Tax Assessment Tax Assessment Total Assessment is a certain percentage of the fair market value that is determined by local assessors to be the total taxable value of land and additions on the property. | Land | Improvement |
|---|---|---|---|---|
| 2025 | $989 | $63,000 | $0 | $0 |
| 2024 | $989 | $60,500 | $0 | $0 |
| 2023 | $954 | $48,300 | $0 | $0 |
| 2022 | $3,155 | $41,600 | $0 | $0 |
| 2021 | $2,372 | $38,600 | $0 | $0 |
| 2020 | $1,760 | $31,600 | $0 | $0 |
| 2019 | $2,104 | $28,700 | $0 | $0 |
| 2018 | $852 | $22,500 | $0 | $0 |
| 2017 | $1,312 | $20,600 | $0 | $0 |
| 2016 | $1,707 | $19,300 | $0 | $0 |
| 2015 | $1,827 | $18,900 | $0 | $0 |
| 2013 | $1,770 | $18,300 | $0 | $0 |
| 2012 | $1,267 | $21,300 | $5,900 | $15,400 |