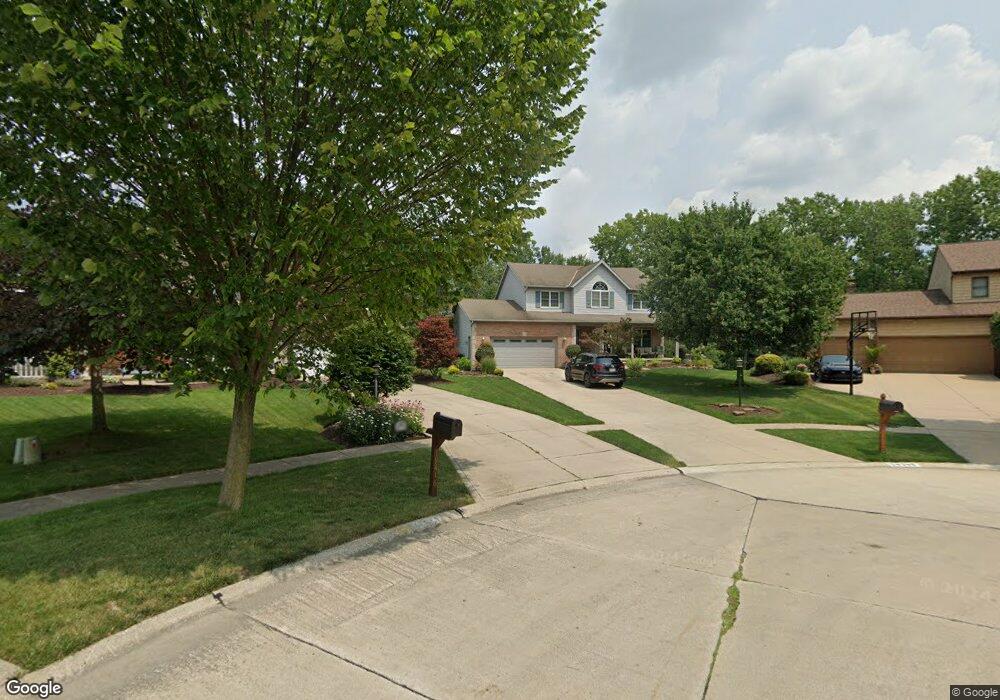
19398 Winding Trail Strongsville, OH 44149
Estimated Value: $406,000 - $451,000
4
Beds
3
Baths
2,378
Sq Ft
$178/Sq Ft
Est. Value
About This Home
This home is located at 19398 Winding Trail, Strongsville, OH 44149 and is currently estimated at $422,867, approximately $177 per square foot. 19398 Winding Trail is a home located in Cuyahoga County with nearby schools including Strongsville High School, Strongsville Academy, and Sts Joseph & John Interparochial School.
Ownership History
Date
Name
Owned For
Owner Type
Purchase Details
Closed on
Oct 26, 2001
Sold by
Vaughan Phillip S
Bought by
Steffish John E and Steffish Mary Ann
Current Estimated Value
Home Financials for this Owner
Home Financials are based on the most recent Mortgage that was taken out on this home.
Original Mortgage
$200,000
Outstanding Balance
$78,631
Interest Rate
6.8%
Estimated Equity
$344,236
Purchase Details
Closed on
Sep 17, 1996
Sold by
Fatholahi Shahin
Bought by
Vaughan Phillip S and Vaughan Kelly J
Home Financials for this Owner
Home Financials are based on the most recent Mortgage that was taken out on this home.
Original Mortgage
$175,057
Interest Rate
8%
Mortgage Type
New Conventional
Purchase Details
Closed on
Feb 11, 1991
Bought by
Fatholahi Shahin
Purchase Details
Closed on
Nov 28, 1989
Bought by
Colabianchi Construction Inc
Purchase Details
Closed on
Jan 1, 1989
Bought by
Crystal Creek Dev
Create a Home Valuation Report for This Property
The Home Valuation Report is an in-depth analysis detailing your home's value as well as a comparison with similar homes in the area
Home Values in the Area
Average Home Value in this Area
Purchase History
| Date | Buyer | Sale Price | Title Company |
|---|---|---|---|
| Steffish John E | $236,000 | Gateway Title Agency Inc | |
| Vaughan Phillip S | $205,950 | -- | |
| Fatholahi Shahin | $170,000 | -- | |
| Colabianchi Construction Inc | -- | -- | |
| Crystal Creek Dev | -- | -- |
Source: Public Records
Mortgage History
| Date | Status | Borrower | Loan Amount |
|---|---|---|---|
| Open | Steffish John E | $200,000 | |
| Closed | Vaughan Phillip S | $175,057 |
Source: Public Records
Tax History Compared to Growth
Tax History
| Year | Tax Paid | Tax Assessment Tax Assessment Total Assessment is a certain percentage of the fair market value that is determined by local assessors to be the total taxable value of land and additions on the property. | Land | Improvement |
|---|---|---|---|---|
| 2024 | $6,242 | $132,930 | $30,345 | $102,585 |
| 2023 | $6,334 | $101,160 | $26,010 | $75,150 |
| 2022 | $6,288 | $101,150 | $26,005 | $75,145 |
| 2021 | $6,239 | $101,150 | $26,010 | $75,150 |
| 2020 | $6,410 | $91,950 | $23,630 | $68,320 |
| 2019 | $6,222 | $262,700 | $67,500 | $195,200 |
| 2018 | $5,555 | $91,950 | $23,630 | $68,320 |
| 2017 | $5,566 | $83,900 | $18,410 | $65,490 |
| 2016 | $5,521 | $83,900 | $18,410 | $65,490 |
| 2015 | $5,232 | $83,900 | $18,410 | $65,490 |
| 2014 | $5,232 | $78,400 | $17,220 | $61,180 |
Source: Public Records
Map
Nearby Homes
- 19513 Lunn Rd
- 19620 Porters Ln Unit 15F
- 14112 Settlers Way
- 19160 Wheelers Ln
- 20078 Trapper Trail
- 18630 Shurmer Rd
- 15279 Walnut Creek Dr
- 19311 Bradford Ct
- 18162 Fawn Cir
- 15017 Regency Dr
- 19908 Stoughton Dr
- 13156 Olympus Way
- 13099 Olympus Way
- 13066 Olympus Way
- 17069 Partridge Dr
- 19297 Lauren Way
- 20678 Spruce Dr
- 14896 Britannia Ct
- 13236 Tomson Dr
- 20393 Wildwood Ln
- 19416 Winding Trail
- 19380 Winding Trail
- 19434 Winding Trail
- 19411 Trotwood Park
- 19439 Trotwood Park
- 14854 Stone Creek Oval
- 19393 Winding Trail
- 14840 Stone Creek Oval
- 19467 Trotwood Park
- 19456 Winding Trail
- 19407 Winding Trail
- 14841 Stone Creek Oval
- 19495 Trotwood Park
- 19421 Winding Trail
- 14826 Stone Creek Oval
- 19474 Winding Trail
- 14827 Stone Creek Oval
- 19523 Trotwood Park
- 15051 Ranchwood Dr
- 19352 Trotwood Park