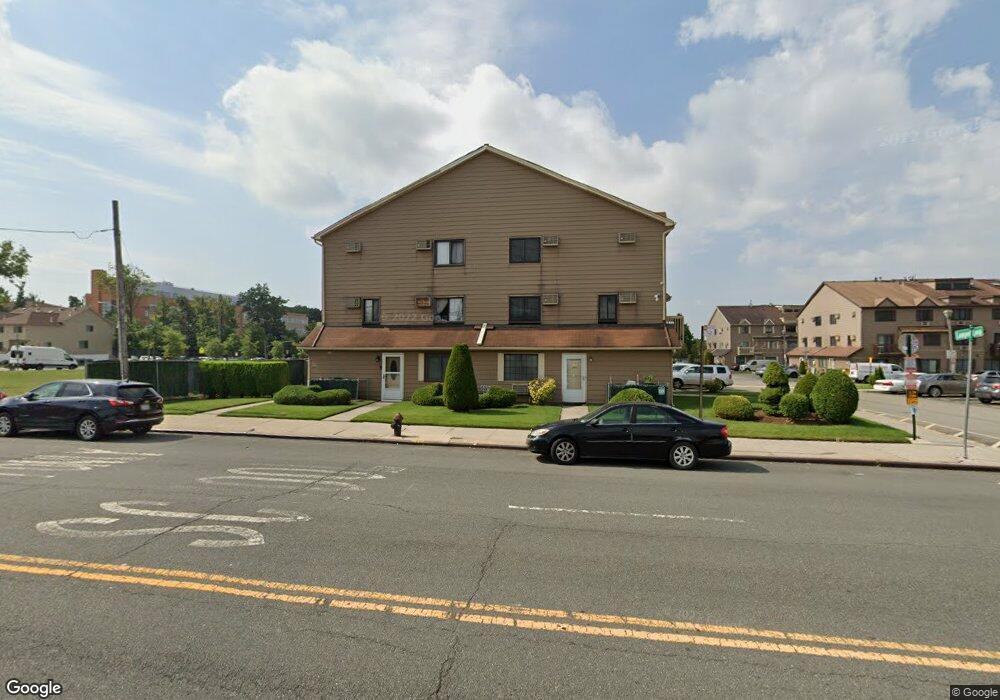
193A Lamped Loop Unit 38 Staten Island, NY 10314
New Springville NeighborhoodEstimated Value: $444,000 - $572,000
--
Bed
--
Bath
1,318
Sq Ft
$388/Sq Ft
Est. Value
About This Home
This home is located at 193A Lamped Loop Unit 38, Staten Island, NY 10314 and is currently estimated at $511,611, approximately $388 per square foot. 193A Lamped Loop Unit 38 is a home located in Richmond County with nearby schools including P.S. 58R Space Shuttle Columbia School, Is 72 Rocco Laurie, and Port Richmond High School.
Ownership History
Date
Name
Owned For
Owner Type
Purchase Details
Closed on
Jan 24, 2017
Sold by
Abdool Cliff A and Jacak Malgorzata
Bought by
Jacak Malgorzata
Current Estimated Value
Purchase Details
Closed on
Oct 22, 2009
Sold by
Abdool Cliff A and Abdool Ashmead C
Bought by
Abdool Cliff A and Jacak Malgorzata
Purchase Details
Closed on
Oct 16, 2000
Sold by
Edelman Carol
Bought by
Abdool Cliff A
Home Financials for this Owner
Home Financials are based on the most recent Mortgage that was taken out on this home.
Original Mortgage
$109,630
Interest Rate
7.78%
Purchase Details
Closed on
Oct 30, 1998
Sold by
Neuman Jeffrey and Edelman Carol
Bought by
Edelman Carol
Create a Home Valuation Report for This Property
The Home Valuation Report is an in-depth analysis detailing your home's value as well as a comparison with similar homes in the area
Home Values in the Area
Average Home Value in this Area
Purchase History
| Date | Buyer | Sale Price | Title Company |
|---|---|---|---|
| Jacak Malgorzata | $142,740 | Alr Abstract Services Llc | |
| Abdool Cliff A | -- | None Available | |
| Abdool Cliff A | $115,500 | Commonwealth Land Title Ins | |
| Edelman Carol | -- | First American Title Ins Co |
Source: Public Records
Mortgage History
| Date | Status | Borrower | Loan Amount |
|---|---|---|---|
| Previous Owner | Abdool Cliff A | $109,630 |
Source: Public Records
Tax History Compared to Growth
Tax History
| Year | Tax Paid | Tax Assessment Tax Assessment Total Assessment is a certain percentage of the fair market value that is determined by local assessors to be the total taxable value of land and additions on the property. | Land | Improvement |
|---|---|---|---|---|
| 2025 | $3,138 | $27,319 | $530 | $26,789 |
| 2024 | $3,138 | $26,656 | $539 | $26,117 |
| 2023 | $2,994 | $14,741 | $481 | $14,260 |
| 2022 | $2,635 | $25,083 | $919 | $24,164 |
| 2021 | $2,761 | $22,430 | $919 | $21,511 |
| 2020 | $2,777 | $22,923 | $919 | $22,004 |
| 2019 | $2,724 | $19,927 | $919 | $19,008 |
| 2018 | $2,504 | $12,284 | $600 | $11,684 |
| 2017 | $2,362 | $11,589 | $615 | $10,974 |
| 2016 | $2,186 | $10,934 | $607 | $10,327 |
| 2015 | $2,082 | $10,934 | $665 | $10,269 |
| 2014 | $2,082 | $10,850 | $613 | $10,237 |
Source: Public Records
Map
Nearby Homes
- 26A Gardenia Ln Unit 96
- 26 Gardenia Ln Unit 95
- 150 Richmond Hill Rd Unit 179
- 75 Villa Nova St
- 60 Lamped Loop Unit 125
- 293 Richmond Hill Rd
- 178 Vassar St
- 42 Westport Ln
- 30 Westport Ln
- 323 Merrymount St
- 20 Racal Ct Unit A2
- 11 Villa Nova St
- 14 Saturn Ln Unit 14
- 228 Nome Ave
- 45A Country Dr E Unit 71
- 2 Elmwood Park Dr Unit 404
- 2 Elmwood Park Dr Unit 610
- 53 Saturn Ln Unit 53
- 34 Country Dr E Unit A45
- 38A Country Dr E Unit 41
- 197A Lamped Loop Unit 36
- 197 Lamped Loop Unit 35
- 193 Lamped Loop Unit 37
- 189 Lamped Loop Unit 39
- 181A Lamped Loop Unit 44
- 189A Lamped Loop Unit 40
- 185A Lamped Loop Unit 42
- 185 Lamped Loop Unit 41
- 185 Lamped Loop Unit A
- 181 Lamped Loop Unit 43
- 181 Lamped Loop Unit A
- 177A Lamped Loop Unit 46
- 177 Lamped Loop Unit 45
- 177 Lamped Loop Unit A46
- 177 Lamped Loop Unit A
- 205A Lamped Loop Unit 32
- 173A Lamped Loop Unit 48
- 173 Lamped Loop Unit 47
- 173 Lamped Loop Unit A
- 182 Lamped Loop Unit 106