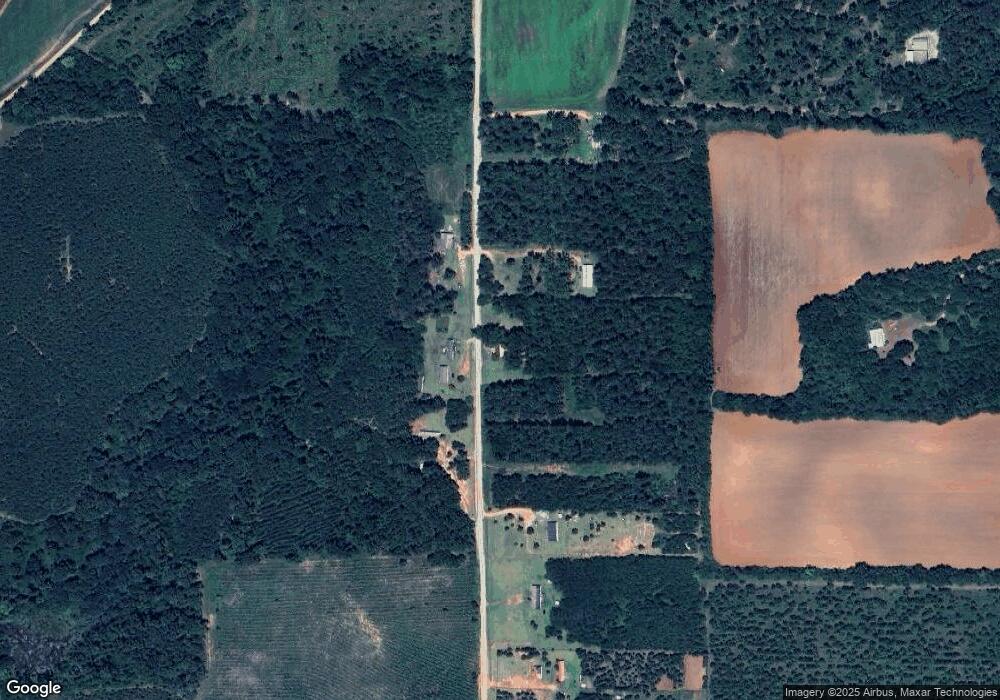
194 Cw Lumpkin Rd Cuthbert, GA 39840
Estimated Value: $125,551 - $211,000
2
Beds
1
Bath
1,722
Sq Ft
$91/Sq Ft
Est. Value
About This Home
This home is located at 194 Cw Lumpkin Rd, Cuthbert, GA 39840 and is currently estimated at $156,184, approximately $90 per square foot. 194 Cw Lumpkin Rd is a home located in Randolph County with nearby schools including Randolph County Elementary School, Randolph Clay Middle School, and Randolph Clay High School.
Ownership History
Date
Name
Owned For
Owner Type
Purchase Details
Closed on
Jun 3, 2012
Sold by
Toal Robert Desmond
Bought by
Toal Robert Desmond
Current Estimated Value
Purchase Details
Closed on
Feb 1, 2008
Sold by
Toal Robert Desmond
Bought by
Cooper Raymond E
Purchase Details
Closed on
Sep 19, 2003
Sold by
Toal Robert Desmond
Bought by
Simmons Michael
Purchase Details
Closed on
Apr 1, 2003
Sold by
Hayes Kristy and Hayes Harvey
Bought by
Toal Robert Desmond
Purchase Details
Closed on
Jun 17, 2002
Sold by
Hayes Kristy and Hayes Harve
Bought by
Manning Ken
Purchase Details
Closed on
Mar 15, 2002
Sold by
Toal Robert
Bought by
Hayes Kristy and Hayes Harve
Create a Home Valuation Report for This Property
The Home Valuation Report is an in-depth analysis detailing your home's value as well as a comparison with similar homes in the area
Home Values in the Area
Average Home Value in this Area
Purchase History
| Date | Buyer | Sale Price | Title Company |
|---|---|---|---|
| Toal Robert Desmond | -- | -- | |
| Toal Robert Desmond | -- | -- | |
| Cooper Raymond E | $25,700 | -- | |
| Cooper Raymond E | $25,700 | -- | |
| Simmons Michael | $26,000 | -- | |
| Simmons Michael | $26,000 | -- | |
| Toal Robert Desmond | -- | -- | |
| Toal Robert Desmond | -- | -- | |
| Manning Ken | $21,200 | -- | |
| Manning Ken | $21,200 | -- | |
| Hayes Kristy | $22,200 | -- | |
| Hayes Kristy | $22,200 | -- |
Source: Public Records
Tax History
| Year | Tax Paid | Tax Assessment Tax Assessment Total Assessment is a certain percentage of the fair market value that is determined by local assessors to be the total taxable value of land and additions on the property. | Land | Improvement |
|---|---|---|---|---|
| 2024 | $1,586 | $38,120 | $6,920 | $31,200 |
| 2023 | $1,436 | $38,120 | $6,920 | $31,200 |
| 2022 | $1,349 | $38,120 | $6,920 | $31,200 |
| 2021 | $895 | $24,914 | $6,938 | $17,976 |
| 2020 | $921 | $24,914 | $6,938 | $17,976 |
| 2019 | $918 | $24,914 | $6,938 | $17,976 |
| 2018 | $879 | $24,914 | $6,938 | $17,976 |
| 2017 | $883 | $24,914 | $6,938 | $17,976 |
| 2016 | $773 | $21,735 | $3,759 | $17,976 |
| 2015 | -- | $21,735 | $3,759 | $17,976 |
| 2014 | -- | $20,516 | $3,759 | $16,757 |
| 2013 | -- | $20,516 | $3,759 | $16,756 |
Source: Public Records
Map
Nearby Homes
- County Line Rd Lot Unit WP001
- 135 Eleven Bridges Rd
- 0 District Line Rd Unit 10518137
- 298 Nelson Coffin Dr
- 203 Wayback Rd
- 3086 Dukes Creek Rd
- 0 County Rd 70
- Pierce Rd
- 396 Hood St
- 00 Hwy 41
- 0 Carver St
- 140 College St
- 42 W Harris St
- 3109 Calhoun St
- 349 Highland Ave
- 5 Pine St
- 1 Pine St
- 4 Pine St
- 0 Pine St
- 365 Highland Ave
Your Personal Tour Guide
Ask me questions while you tour the home.