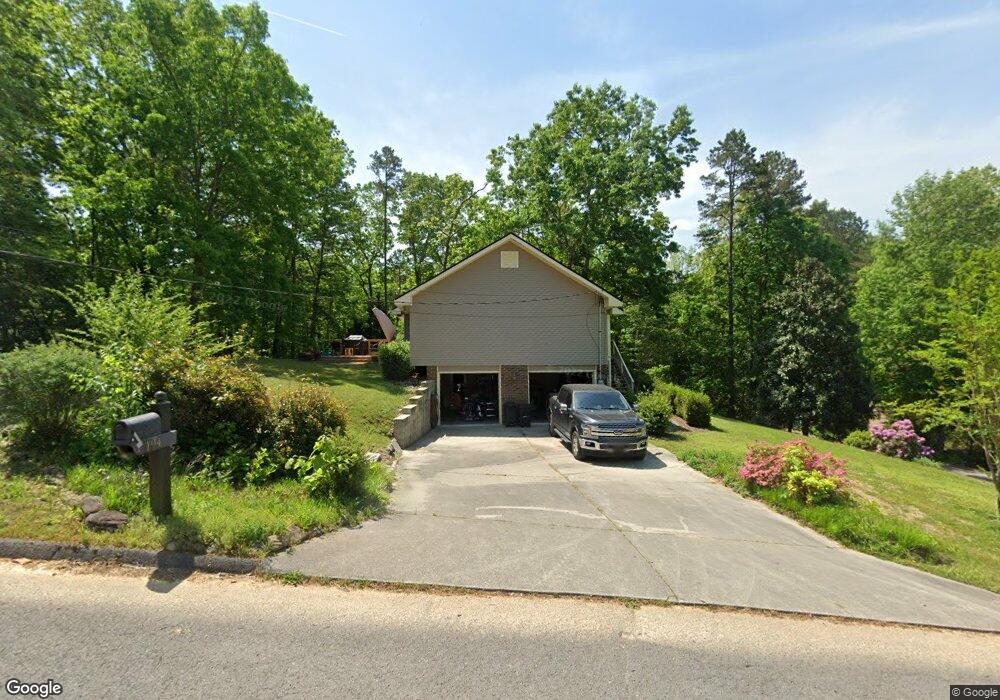
194 Fox Run Cir N Flintstone, GA 30725
Flintstone NeighborhoodEstimated Value: $227,806 - $274,000
4
Beds
3
Baths
2,170
Sq Ft
$119/Sq Ft
Est. Value
About This Home
This home is located at 194 Fox Run Cir N, Flintstone, GA 30725 and is currently estimated at $257,202, approximately $118 per square foot. 194 Fox Run Cir N is a home located in Walker County with nearby schools including Chattanooga Valley Elementary School, Chattanooga Valley Middle School, and Ridgeland High School.
Ownership History
Date
Name
Owned For
Owner Type
Purchase Details
Closed on
Jul 8, 2002
Sold by
Franklyn Dina K
Bought by
Pennington Rebecca
Current Estimated Value
Purchase Details
Closed on
Dec 3, 2001
Sold by
Lea Johnny D and Lea Sharon
Bought by
Franklyn Dina K
Purchase Details
Closed on
Jul 19, 1996
Sold by
Smith Carey F and Steel Linda F
Bought by
Lea Johnny D and Lea Sharon
Purchase Details
Closed on
Jul 27, 1990
Sold by
Son Mcdowell and Son Homebuilders
Bought by
Smith Carey F and Steel Linda F
Purchase Details
Closed on
Dec 1, 1988
Sold by
Kirby Brent G and Kirby Jaycee
Bought by
Son Mcdowell and Son Homebuilders
Purchase Details
Closed on
Nov 21, 1988
Sold by
Gentry Ann L
Bought by
Kirby Brent G and Kirby Jaycee
Purchase Details
Closed on
Jan 1, 1972
Bought by
Gentry Ann L
Create a Home Valuation Report for This Property
The Home Valuation Report is an in-depth analysis detailing your home's value as well as a comparison with similar homes in the area
Home Values in the Area
Average Home Value in this Area
Purchase History
| Date | Buyer | Sale Price | Title Company |
|---|---|---|---|
| Pennington Rebecca | $122,200 | -- | |
| Franklyn Dina K | $106,500 | -- | |
| Lea Johnny D | -- | -- | |
| Smith Carey F | $67,900 | -- | |
| Son Mcdowell | -- | -- | |
| Kirby Brent G | -- | -- | |
| Gentry Ann L | -- | -- |
Source: Public Records
Tax History
| Year | Tax Paid | Tax Assessment Tax Assessment Total Assessment is a certain percentage of the fair market value that is determined by local assessors to be the total taxable value of land and additions on the property. | Land | Improvement |
|---|---|---|---|---|
| 2025 | $1,835 | $94,296 | $14,000 | $80,296 |
| 2024 | $1,897 | $85,916 | $6,600 | $79,316 |
| 2023 | $1,809 | $80,018 | $5,000 | $75,018 |
| 2022 | $1,698 | $69,148 | $5,000 | $64,148 |
| 2021 | $1,373 | $50,030 | $5,000 | $45,030 |
| 2020 | $1,184 | $41,176 | $5,000 | $36,176 |
| 2019 | $1,205 | $41,210 | $5,000 | $36,210 |
| 2018 | $1,090 | $41,210 | $5,000 | $36,210 |
| 2017 | $1,089 | $41,210 | $5,000 | $36,210 |
| 2016 | $1,089 | $41,210 | $5,000 | $36,210 |
| 2015 | $1,151 | $41,199 | $5,000 | $36,199 |
| 2014 | $1,054 | $41,199 | $5,000 | $36,199 |
| 2013 | $1,090 | $41,199 | $5,000 | $36,199 |
Source: Public Records
Map
Nearby Homes
- 0 Fox Run Cir S
- 262 Fox Run Cir S
- 569 Tinker Bell Cir
- 234 Tinker Bell Cir
- 2937 Happy Valley Rd
- 306 Dry Valley Rd
- 4752 Happy Valley Rd
- 307 Draft St
- 313 Draft St
- 300 Draft St
- 334 Draft St
- 248 Hawks Dr
- 277 Draft St
- 243 Hawks Dr
- 57 Buck Creek Ln
- 222 Hawks Dr
- 240 Hawks Dr
- 86 Buck Creek Ln
- 235 Hawks Dr
- 185 Hawks Dr
- 148 Fox Run Cir N
- 197 Fox Run Cir
- 188 Fox Run Cir N
- 87 Fox Lair Trail
- 161 Fox Run Cir N
- 122 Fox Run Cir N
- 80 Fox Run Cir N
- 231 Fox Run Cir S
- 15 Fox Lair Trail
- 64 Fox Run Cir N
- 125 Fox Run Cir N Unit 1
- 125 Fox Run Cir N
- 95 Fox Run Cir N
- 0 Fox Run Cir N
- N Fox Run Cir N
- 226 Fox Run Cir S
- 117 Fox Run Cir S
- 38 Fox Run Cir N
- 125 Fox Run Cir S
- 208 Fox Run Cir S
Your Personal Tour Guide
Ask me questions while you tour the home.