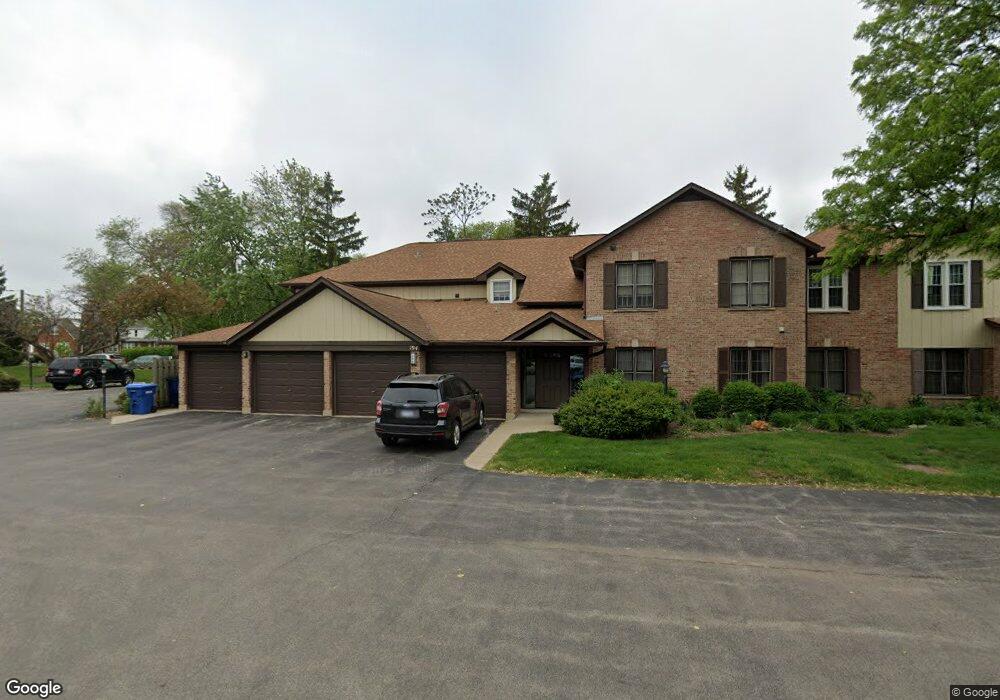
194 Grove Ave Unit 31A Des Plaines, IL 60016
Estimated Value: $276,000 - $318,000
--
Bed
--
Bath
14,218
Sq Ft
$21/Sq Ft
Est. Value
About This Home
This home is located at 194 Grove Ave Unit 31A, Des Plaines, IL 60016 and is currently estimated at $291,911, approximately $20 per square foot. 194 Grove Ave Unit 31A is a home located in Cook County with nearby schools including North Elementary School, Chippewa Middle School, and Maine West High School.
Ownership History
Date
Name
Owned For
Owner Type
Purchase Details
Closed on
Jun 30, 2017
Sold by
Bujdos Jozef and Bujdos Jana
Bought by
Piscopo Dean A
Current Estimated Value
Home Financials for this Owner
Home Financials are based on the most recent Mortgage that was taken out on this home.
Original Mortgage
$164,350
Outstanding Balance
$136,958
Interest Rate
4%
Mortgage Type
New Conventional
Estimated Equity
$154,953
Purchase Details
Closed on
Jan 18, 2016
Sold by
Hindman William J
Bought by
Bujdos Jozef and Bujdos Jana
Home Financials for this Owner
Home Financials are based on the most recent Mortgage that was taken out on this home.
Original Mortgage
$118,800
Interest Rate
4.87%
Mortgage Type
New Conventional
Purchase Details
Closed on
Sep 10, 1993
Sold by
Brel Terese M
Bought by
Choi Sung Yong
Home Financials for this Owner
Home Financials are based on the most recent Mortgage that was taken out on this home.
Original Mortgage
$107,100
Interest Rate
7%
Mortgage Type
Purchase Money Mortgage
Create a Home Valuation Report for This Property
The Home Valuation Report is an in-depth analysis detailing your home's value as well as a comparison with similar homes in the area
Home Values in the Area
Average Home Value in this Area
Purchase History
| Date | Buyer | Sale Price | Title Company |
|---|---|---|---|
| Piscopo Dean A | $176,000 | Saturn Title Llc | |
| Bujdos Jozef | $148,500 | Precision Title | |
| Choi Sung Yong | $79,333 | -- |
Source: Public Records
Mortgage History
| Date | Status | Borrower | Loan Amount |
|---|---|---|---|
| Open | Piscopo Dean A | $164,350 | |
| Previous Owner | Bujdos Jozef | $118,800 | |
| Previous Owner | Choi Sung Yong | $107,100 |
Source: Public Records
Tax History Compared to Growth
Tax History
| Year | Tax Paid | Tax Assessment Tax Assessment Total Assessment is a certain percentage of the fair market value that is determined by local assessors to be the total taxable value of land and additions on the property. | Land | Improvement |
|---|---|---|---|---|
| 2024 | $3,799 | $17,726 | $3,197 | $14,529 |
| 2023 | $3,681 | $17,726 | $3,197 | $14,529 |
| 2022 | $3,681 | $17,726 | $3,197 | $14,529 |
| 2021 | $2,542 | $11,601 | $3,882 | $7,719 |
| 2020 | $2,568 | $11,601 | $3,882 | $7,719 |
| 2019 | $2,579 | $13,012 | $3,882 | $9,130 |
| 2018 | $2,100 | $10,456 | $3,425 | $7,031 |
| 2017 | $3,072 | $10,456 | $3,425 | $7,031 |
| 2016 | $2,906 | $10,456 | $3,425 | $7,031 |
| 2015 | $2,981 | $9,862 | $2,968 | $6,894 |
| 2014 | $2,919 | $9,862 | $2,968 | $6,894 |
| 2013 | $2,087 | $9,862 | $2,968 | $6,894 |
Source: Public Records
Map
Nearby Homes
- 1578 Woodland Ave Unit D
- 1433 Willow Ave
- 430 Oak St
- 365 Graceland Ave Unit 205A
- 394 Alles St Unit 3B
- 185 Eli Ct
- 184 Lilah Ct
- 182 Lilah Ct
- 182 Eli Ct
- 395 Graceland Ave Unit 207
- 476 Alles St Unit 508
- 476 Alles St Unit 210
- 501 Alles St Unit 501A
- 555 S River Rd Unit 301
- 1279 Harding Ave Unit 3B
- 1279 Harding Ave Unit 2B
- 1470 Jefferson St Unit 504
- 1470 Jefferson St Unit 405
- 1389 Perry St Unit 303
- 550 Ida St Unit 2NW
- 194 Grove Ave Unit 32D
- 194 Grove Ave Unit 32C
- 194 Grove Ave Unit 31B
- 194 Grove Ave Unit A
- 194 Grove Ave Unit 1B
- 194 Grove Ave Unit C
- 192 Grove Ave Unit 41B
- 192 Grove Ave Unit 42C
- 192 Grove Ave Unit 42D
- 192 Grove Ave Unit 41A
- 192 Grove Ave Unit D
- 192 Grove Ave Unit A
- 1578 Woodland Ave Unit B
- 1578 Woodland Ave
- 1578 Woodland Ave
- 1578 Woodland Ave
- 1578 Woodland Ave
- 1578 Woodland Ave
- 1578 Woodland Ave
- 1578 Woodland Ave Unit C