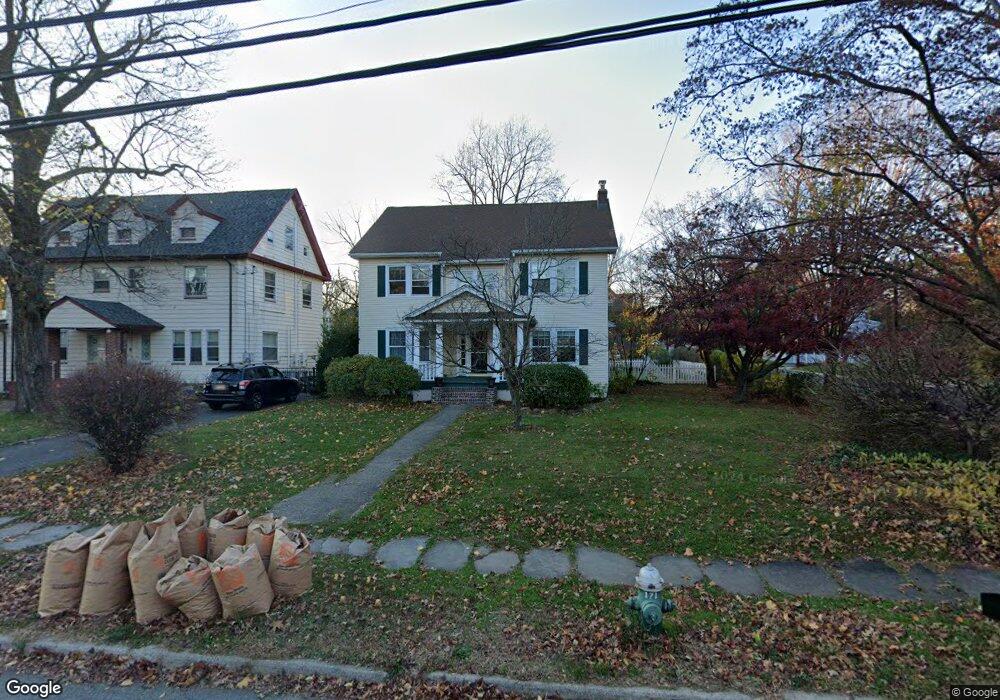
194 Grove St Montclair, NJ 07042
Estimated Value: $1,141,691 - $1,534,000
Studio
--
Bath
2,522
Sq Ft
$511/Sq Ft
Est. Value
About This Home
This home is located at 194 Grove St, Montclair, NJ 07042 and is currently estimated at $1,288,923, approximately $511 per square foot. 194 Grove St is a home located in Essex County with nearby schools including Hillside School, Nishuane School, and Bradford School.
Ownership History
Date
Name
Owned For
Owner Type
Purchase Details
Closed on
Mar 15, 2010
Sold by
Huba Kimberly and Oliva Luis M
Bought by
Fox Mary Ellen and Mccollam Moira M
Current Estimated Value
Home Financials for this Owner
Home Financials are based on the most recent Mortgage that was taken out on this home.
Original Mortgage
$300,000
Outstanding Balance
$198,436
Interest Rate
4.94%
Mortgage Type
New Conventional
Estimated Equity
$1,090,487
Purchase Details
Closed on
Jul 3, 2008
Sold by
Huba Kimberly
Bought by
Huba Kimberly and Oliva Luis M
Home Financials for this Owner
Home Financials are based on the most recent Mortgage that was taken out on this home.
Original Mortgage
$445,000
Interest Rate
6.37%
Mortgage Type
Purchase Money Mortgage
Purchase Details
Closed on
Mar 23, 2003
Sold by
Brndjar Paul
Bought by
Huba Kimberly
Create a Home Valuation Report for This Property
The Home Valuation Report is an in-depth analysis detailing your home's value as well as a comparison with similar homes in the area
Home Values in the Area
Average Home Value in this Area
Purchase History
| Date | Buyer | Sale Price | Title Company |
|---|---|---|---|
| Fox Mary Ellen | $470,000 | Multiple | |
| Huba Kimberly | -- | Prodigy Title Llc | |
| Huba Kimberly | $360,000 | -- |
Source: Public Records
Mortgage History
| Date | Status | Borrower | Loan Amount |
|---|---|---|---|
| Open | Fox Mary Ellen | $300,000 | |
| Previous Owner | Huba Kimberly | $445,000 | |
| Closed | Huba Kimberly | $0 |
Source: Public Records
Tax History
| Year | Tax Paid | Tax Assessment Tax Assessment Total Assessment is a certain percentage of the fair market value that is determined by local assessors to be the total taxable value of land and additions on the property. | Land | Improvement |
|---|---|---|---|---|
| 2025 | $17,883 | $525,500 | $289,800 | $235,700 |
| 2024 | $17,762 | $525,500 | $289,800 | $235,700 |
| 2022 | $17,278 | $525,500 | $289,800 | $235,700 |
| 2021 | $16,979 | $525,500 | $289,800 | $235,700 |
| 2020 | $16,706 | $525,500 | $289,800 | $235,700 |
| 2019 | $16,532 | $525,500 | $289,800 | $235,700 |
| 2018 | $16,265 | $525,700 | $289,800 | $235,900 |
| 2017 | $18,129 | $485,500 | $275,200 | $210,300 |
| 2016 | $17,643 | $485,500 | $275,200 | $210,300 |
| 2015 | $17,119 | $465,000 | $275,200 | $189,800 |
| 2014 | $15,847 | $465,000 | $275,200 | $189,800 |
Source: Public Records
Map
Nearby Homes
- 97 Montclair Ave
- 41 Glenridge Ave Unit 2L
- 170 Christopher St
- 68 Chestnut St
- 264 Forest Ave
- 256 Forest Ave
- 197 N Fullerton Ave
- 16 Stephen St
- 281 Forest Ave
- 17 Mendl Terrace
- 5 Inness Place
- 163 Park St
- 166 Montclair Ave
- 119 Walnut St Unit 1
- 381 Essex Ave
- 96 Grove St
- 17 Glen Ridge Pkwy
- 153 Walnut St
- 153 Walnut St Unit 2
- 26 Clairidge Ct
- 190 Grove St
- 198 Grove St
- 47 Columbus Ave
- 188 Grove St
- 200 Grove St
- 87 Christopher St
- 85 Christopher St Unit 1
- 85 Christopher St
- 85 Christopher St Unit 2
- 91 Christopher St
- 191 Grove St
- 186 Grove St
- 202 Grove St
- 83 Christopher St
- 189 Grove St
- 187 Grove St
- 93 Christopher St
- 81 Christopher St
- 199 Grove St
- 185 Grove St
Your Personal Tour Guide
Ask me questions while you tour the home.