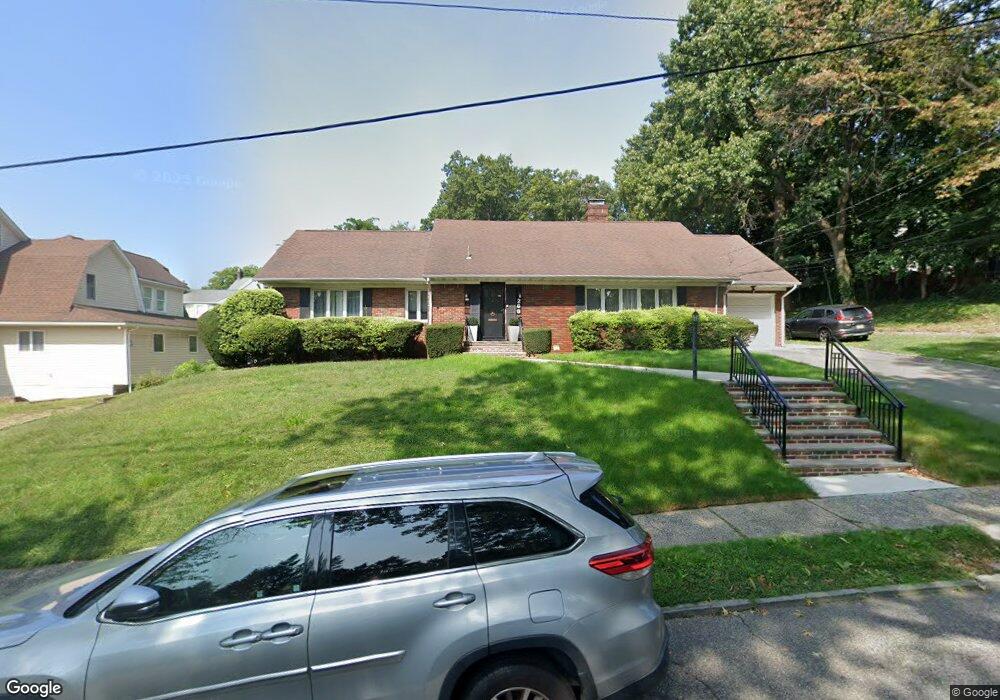
194 High St Unit 200 Passaic, NJ 07055
Estimated Value: $902,911 - $1,050,000
--
Bed
--
Bath
2,891
Sq Ft
$347/Sq Ft
Est. Value
About This Home
This home is located at 194 High St Unit 200, Passaic, NJ 07055 and is currently estimated at $1,002,228, approximately $346 per square foot. 194 High St Unit 200 is a home located in Passaic County with nearby schools including Passaic High School # 12, Yeshiva Ktana Of Passaic Girls, and Mesivta of North Jersey.
Ownership History
Date
Name
Owned For
Owner Type
Purchase Details
Closed on
Jul 31, 2013
Sold by
Grossman Herschel and Krischer Sima
Bought by
Beningson David and Beningson Judith
Current Estimated Value
Home Financials for this Owner
Home Financials are based on the most recent Mortgage that was taken out on this home.
Original Mortgage
$138,000
Interest Rate
1.22%
Mortgage Type
Purchase Money Mortgage
Purchase Details
Closed on
Jul 11, 2012
Sold by
Grossman Morton and Grossman Erna
Bought by
Grossman Herschel and Krischer Sima
Purchase Details
Closed on
Aug 12, 2010
Sold by
Crisostomo Gracia
Bought by
Grossman Morton and Grossman Erna
Home Financials for this Owner
Home Financials are based on the most recent Mortgage that was taken out on this home.
Original Mortgage
$378,000
Interest Rate
4.57%
Mortgage Type
Purchase Money Mortgage
Create a Home Valuation Report for This Property
The Home Valuation Report is an in-depth analysis detailing your home's value as well as a comparison with similar homes in the area
Home Values in the Area
Average Home Value in this Area
Purchase History
| Date | Buyer | Sale Price | Title Company |
|---|---|---|---|
| Beningson David | $488,000 | Agent For Conestoga Title | |
| Grossman Herschel | -- | Chicago Title Insurance Co | |
| Grossman Morton | $478,000 | -- |
Source: Public Records
Mortgage History
| Date | Status | Borrower | Loan Amount |
|---|---|---|---|
| Previous Owner | Beningson David | $138,000 | |
| Previous Owner | Grossman Morton | $378,000 |
Source: Public Records
Tax History Compared to Growth
Tax History
| Year | Tax Paid | Tax Assessment Tax Assessment Total Assessment is a certain percentage of the fair market value that is determined by local assessors to be the total taxable value of land and additions on the property. | Land | Improvement |
|---|---|---|---|---|
| 2025 | $17,985 | $436,200 | $158,400 | $277,800 |
| 2024 | $17,465 | $436,200 | $158,400 | $277,800 |
| 2022 | $16,942 | $436,200 | $158,400 | $277,800 |
| 2021 | $16,401 | $436,200 | $158,400 | $277,800 |
| 2020 | $16,275 | $436,200 | $158,400 | $277,800 |
| 2019 | $16,039 | $436,200 | $158,400 | $277,800 |
| 2018 | $15,694 | $436,200 | $158,400 | $277,800 |
| 2017 | $15,210 | $436,200 | $158,400 | $277,800 |
| 2016 | $14,691 | $436,200 | $158,400 | $277,800 |
| 2015 | $16,539 | $218,400 | $62,800 | $155,600 |
| 2014 | $16,236 | $218,400 | $62,800 | $155,600 |
Source: Public Records
Map
Nearby Homes
- 10 Ascension St
- 5-13 Ascension St Unit 1H
- 119 High St
- 285 Aycrigg Ave Unit 19H
- 285 Aycrigg Ave Unit 19G
- 285 Aycrigg Ave Unit 20C
- 285 Aycrigg Ave Unit 22D
- 285 Aycrigg Ave Unit 10E
- 135 Park Ave
- 323 Van Houten Ave
- 243 Lafayette Ave
- 15 Albion St
- 85 Gregory Ave
- 72 Richard St Unit 3
- 72 Richard St
- 2 Terry St
- 455 Passaic Ave Unit 2A
- 416 River Renaissance Unit A16
- 416 River Renaissance
- 194-200 High St
- 202 High St
- 192 High St
- 184 High St
- 190 High St
- 92 Ascension St
- 11 Randolph St Unit 13
- 96 Ascension St
- 176 High St
- 76 Ascension St
- 15 Randolph St
- 179 High St
- 185-193 High St
- 100 Ascension St
- 185 High St Unit 193
- 25 Randolph St
- 72 Ascension St
- 19 Randolph St
- 175 High St
- 83 Ascension St