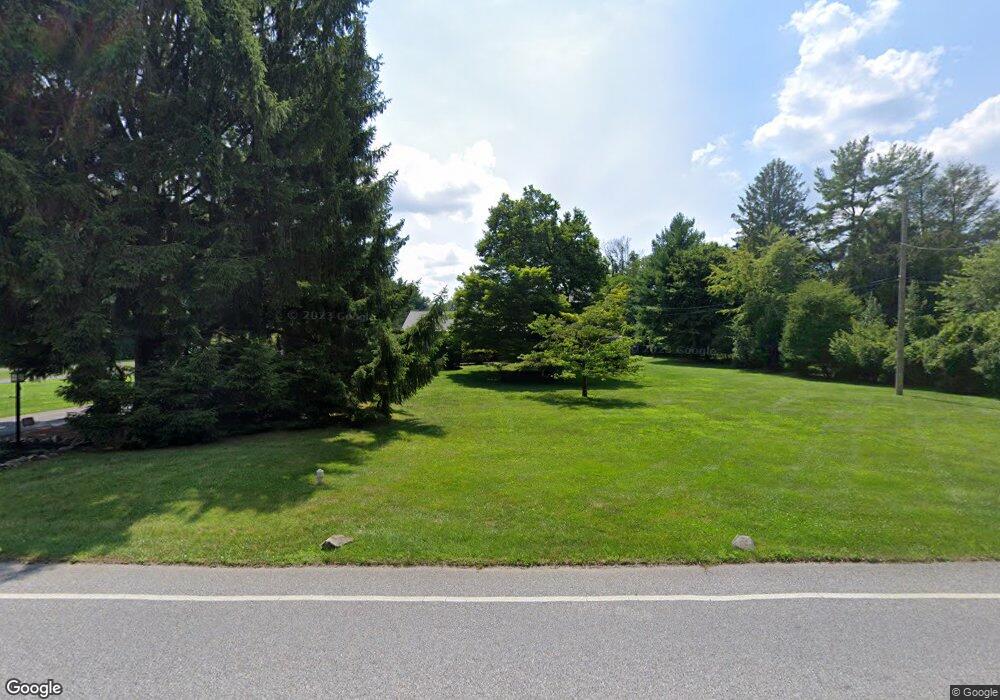
194 Kirk Rd Garnet Valley, PA 19060
Estimated Value: $687,415 - $774,000
4
Beds
2
Baths
2,600
Sq Ft
$284/Sq Ft
Est. Value
About This Home
This home is located at 194 Kirk Rd, Garnet Valley, PA 19060 and is currently estimated at $738,854, approximately $284 per square foot. 194 Kirk Rd is a home located in Delaware County with nearby schools including Garnet Valley High School, St. Thomas Apostle School, and St Cornelius School.
Ownership History
Date
Name
Owned For
Owner Type
Purchase Details
Closed on
Nov 28, 2011
Sold by
Capps Kathy Bailey
Bought by
Hollingsworth Erik and Hollingsworth Lisette
Current Estimated Value
Purchase Details
Closed on
Jan 23, 2009
Sold by
Capps Kathy Bailey and Scott Audrey Nichole
Bought by
Capps Kathy Bailey
Home Financials for this Owner
Home Financials are based on the most recent Mortgage that was taken out on this home.
Original Mortgage
$316,172
Interest Rate
5.28%
Mortgage Type
FHA
Purchase Details
Closed on
Jan 25, 2008
Sold by
Ayers Michael G
Bought by
Bailey Capps Kathy and Scott Audrey Nichole
Home Financials for this Owner
Home Financials are based on the most recent Mortgage that was taken out on this home.
Original Mortgage
$296,650
Interest Rate
6.18%
Mortgage Type
FHA
Create a Home Valuation Report for This Property
The Home Valuation Report is an in-depth analysis detailing your home's value as well as a comparison with similar homes in the area
Home Values in the Area
Average Home Value in this Area
Purchase History
| Date | Buyer | Sale Price | Title Company |
|---|---|---|---|
| Hollingsworth Erik | $350,000 | None Available | |
| Capps Kathy Bailey | $53,690 | Commonwealth Land Title Insu | |
| Bailey Capps Kathy | $299,000 | None Available |
Source: Public Records
Mortgage History
| Date | Status | Borrower | Loan Amount |
|---|---|---|---|
| Previous Owner | Capps Kathy Bailey | $316,172 | |
| Previous Owner | Bailey Capps Kathy | $296,650 |
Source: Public Records
Tax History Compared to Growth
Tax History
| Year | Tax Paid | Tax Assessment Tax Assessment Total Assessment is a certain percentage of the fair market value that is determined by local assessors to be the total taxable value of land and additions on the property. | Land | Improvement |
|---|---|---|---|---|
| 2025 | $9,080 | $398,830 | $131,590 | $267,240 |
| 2024 | $9,080 | $398,830 | $131,590 | $267,240 |
| 2023 | $8,854 | $398,830 | $131,590 | $267,240 |
| 2022 | $8,756 | $398,830 | $131,590 | $267,240 |
| 2021 | $14,723 | $398,830 | $131,590 | $267,240 |
| 2020 | $9,335 | $236,250 | $62,430 | $173,820 |
| 2019 | $9,197 | $236,250 | $62,430 | $173,820 |
| 2018 | $9,056 | $236,250 | $0 | $0 |
| 2017 | $8,871 | $236,250 | $0 | $0 |
| 2016 | $1,323 | $236,250 | $0 | $0 |
| 2015 | $1,323 | $236,250 | $0 | $0 |
| 2014 | $1,323 | $236,250 | $0 | $0 |
Source: Public Records
Map
Nearby Homes
- 153 Kirk Rd
- 882 Shavertown Rd
- 27 Cherry Cir
- 28 W Houndpack Way
- 37 Kirk Rd
- 64 Kirk Rd
- 990 Smithbridge Rd
- 209 N Silver Fox Dr Unit 479
- 3671 Marian Dr
- 1604 E Fox Brushs Way
- 1406 S Hunting Horn Turn Unit 385
- 1168 Naamans Creek Rd
- 1000 N Phipps Woods Ct Unit 486
- 3 Bethel Rd
- 1204 Lot # 2 Naamans Creek
- 48 Partridge Ln
- 202 Conchester Rd
- 1212 Naamans Creek Rd
- 1063 Belmont Ln
- 3003 Half Mile Post S