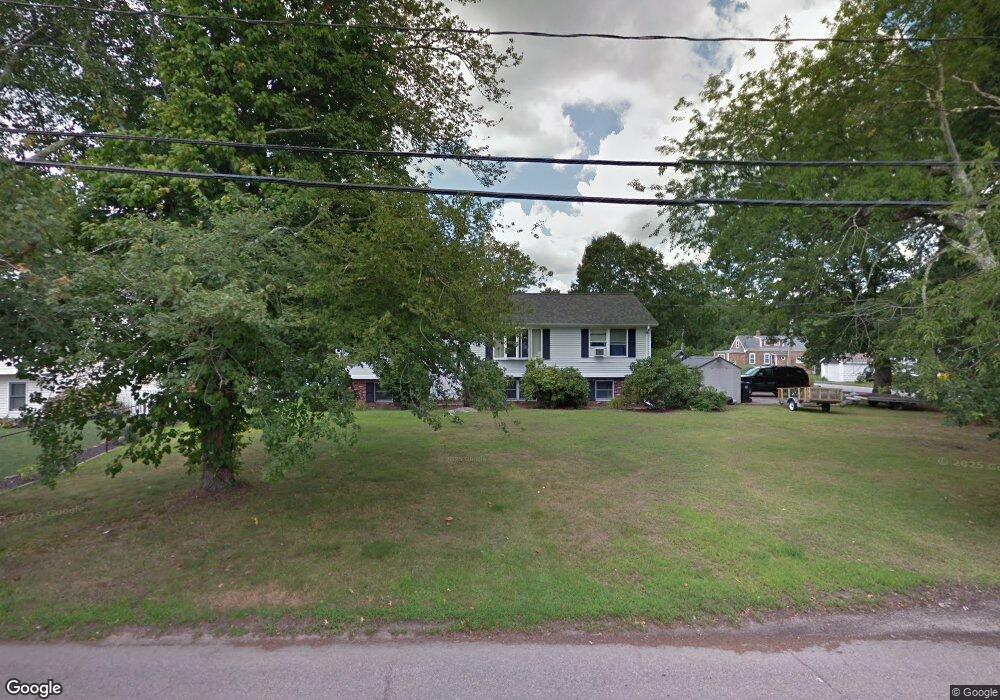
194 Milton St South Dartmouth, MA 02748
Bliss Corner NeighborhoodEstimated Value: $448,000 - $597,000
3
Beds
3
Baths
1,398
Sq Ft
$384/Sq Ft
Est. Value
About This Home
This home is located at 194 Milton St, South Dartmouth, MA 02748 and is currently estimated at $536,177, approximately $383 per square foot. 194 Milton St is a home located in Bristol County with nearby schools including Dartmouth High School, St. Teresa of Calcutta School, and Our Sister's School.
Ownership History
Date
Name
Owned For
Owner Type
Purchase Details
Closed on
Feb 7, 2022
Sold by
Mcknight Stephen H and Mcknight Alison
Bought by
Mcknight Stephen H
Current Estimated Value
Purchase Details
Closed on
Oct 5, 1995
Sold by
Verissimo Jorge
Bought by
Canha Lee Marie
Purchase Details
Closed on
Mar 20, 1995
Sold by
Santos Alfred C and Santos Joyce A
Bought by
Verissimo Jorge
Purchase Details
Closed on
Sep 13, 1994
Sold by
Santos Alfred C and Santos Joyce A
Bought by
Mcknight Stephen H and Mcknight Alison
Create a Home Valuation Report for This Property
The Home Valuation Report is an in-depth analysis detailing your home's value as well as a comparison with similar homes in the area
Home Values in the Area
Average Home Value in this Area
Purchase History
| Date | Buyer | Sale Price | Title Company |
|---|---|---|---|
| Mcknight Stephen H | -- | None Available | |
| Canha Lee Marie | $139,000 | -- | |
| Verissimo Jorge | $38,000 | -- | |
| Mcknight Stephen H | $145,000 | -- |
Source: Public Records
Mortgage History
| Date | Status | Borrower | Loan Amount |
|---|---|---|---|
| Previous Owner | Mcknight Stephen H | $88,000 | |
| Previous Owner | Mcknight Stephen H | $20,000 |
Source: Public Records
Tax History Compared to Growth
Tax History
| Year | Tax Paid | Tax Assessment Tax Assessment Total Assessment is a certain percentage of the fair market value that is determined by local assessors to be the total taxable value of land and additions on the property. | Land | Improvement |
|---|---|---|---|---|
| 2025 | $3,708 | $430,700 | $174,700 | $256,000 |
| 2024 | $3,557 | $409,300 | $166,700 | $242,600 |
| 2023 | $3,365 | $367,000 | $154,600 | $212,400 |
| 2022 | $3,342 | $337,600 | $147,800 | $189,800 |
| 2021 | $3,256 | $314,300 | $130,500 | $183,800 |
| 2020 | $3,179 | $306,300 | $130,500 | $175,800 |
| 2019 | $3,083 | $296,400 | $130,500 | $165,900 |
| 2018 | $2,842 | $279,900 | $130,500 | $149,400 |
| 2017 | $2,751 | $274,600 | $123,100 | $151,500 |
| 2016 | $2,696 | $265,400 | $123,100 | $142,300 |
| 2015 | $2,629 | $259,300 | $115,000 | $144,300 |
| 2014 | $2,507 | $245,500 | $104,300 | $141,200 |
Source: Public Records
Map
Nearby Homes