Estimated Value: $274,019 - $648,000
Studio
--
Bath
936
Sq Ft
$423/Sq Ft
Est. Value
About This Home
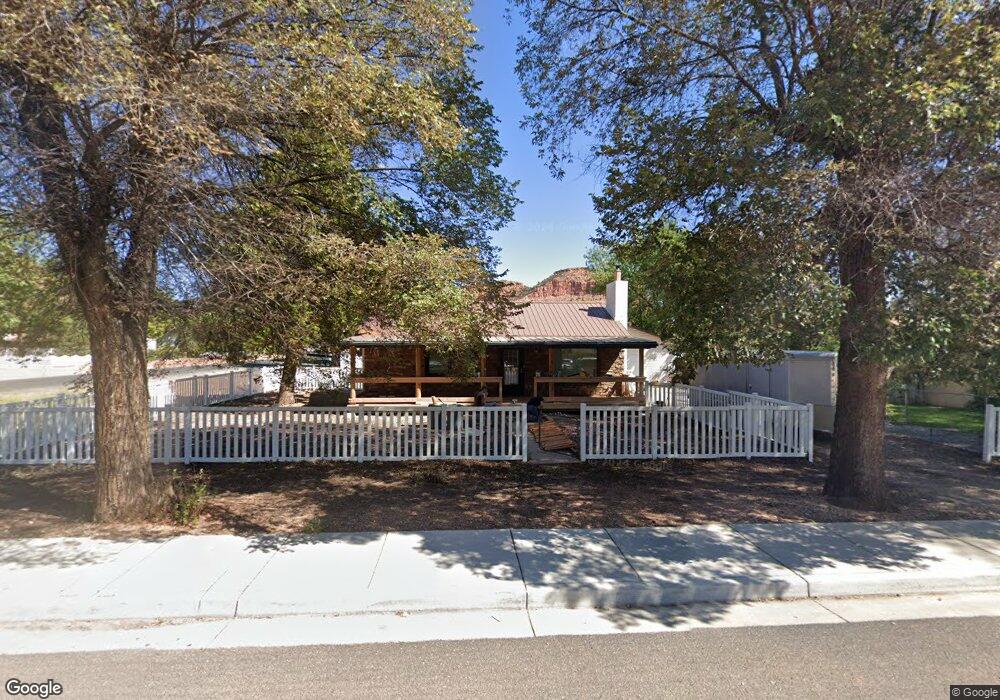
This home is located at 194 N Main St, Kanab, UT 84741 and is currently estimated at $395,505, approximately $422 per square foot. 194 N Main St is a home located in Kane County with nearby schools including Kanab Elementary School, Kanab Middle School, and Kanab High School.
Ownership History
Date
Name
Owned For
Owner Type
Purchase Details
Closed on
Nov 14, 2017
Bought by
Helms Clifford J
Current Estimated Value
Purchase Details
Closed on
Aug 3, 2012
Sold by
Mcfall By Paula B Swapp Keith L and Swapp Paula B
Bought by
Swapp Eldon N and Swapp Paula B
Purchase Details
Closed on
Oct 12, 2007
Sold by
Mcfall Keith L
Bought by
Mcfall Keith L and Swapp Paula B
Create a Home Valuation Report for This Property
The Home Valuation Report is an in-depth analysis detailing your home's value as well as a comparison with similar homes in the area
Home Values in the Area
Average Home Value in this Area
Purchase History
| Date | Buyer | Sale Price | Title Company |
|---|---|---|---|
| Helms Clifford J | -- | -- | |
| Swapp Eldon N | -- | -- | |
| Mcfall Keith L | -- | -- |
Source: Public Records
Tax History
| Year | Tax Paid | Tax Assessment Tax Assessment Total Assessment is a certain percentage of the fair market value that is determined by local assessors to be the total taxable value of land and additions on the property. | Land | Improvement |
|---|---|---|---|---|
| 2025 | -- | $208,523 | $102,829 | $105,694 |
| 2024 | $1,071 | $124,497 | $45,841 | $78,656 |
| 2023 | $967 | $115,163 | $43,658 | $71,505 |
| 2022 | $836 | $98,588 | $33,584 | $65,004 |
| 2021 | $760 | $134,518 | $46,970 | $87,548 |
| 2020 | $734 | $126,155 | $42,700 | $83,455 |
| 2019 | $726 | $121,404 | $43,956 | $77,448 |
| 2018 | $688 | $114,078 | $36,630 | $77,448 |
| 2017 | $658 | $104,229 | $33,300 | $70,929 |
| 2016 | $600 | $92,223 | $33,300 | $58,923 |
| 2015 | $606 | $94,063 | $33,300 | $60,763 |
| 2014 | $606 | $92,672 | $35,823 | $56,849 |
| 2013 | -- | $50,970 | $0 | $0 |
Source: Public Records
Map
Nearby Homes
Your Personal Tour Guide
Ask me questions while you tour the home.